
Figures & data
Figure 1. Determinants of a landlord’s propensity to displace their tenants.
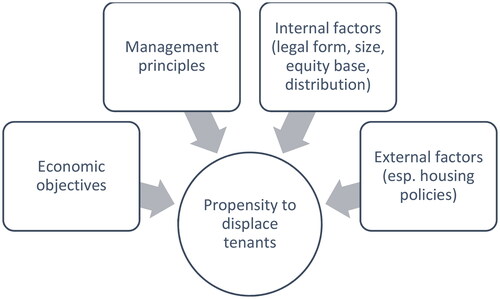
Table 1. Ownership structure of the rental housing stock in Berlin (2011).
Table 2. Distribution of landlord types in the study area.
Table 3. Interview sample.
Figure 2. Displacement rate by landlord type (based on moving households).
Source: Authors’ own survey, N = 1,833. Since not all respondents were able to indicate the ownership type of their rental property before they moved, N is significantly lower than the overall response of 2,082 questionnaires.
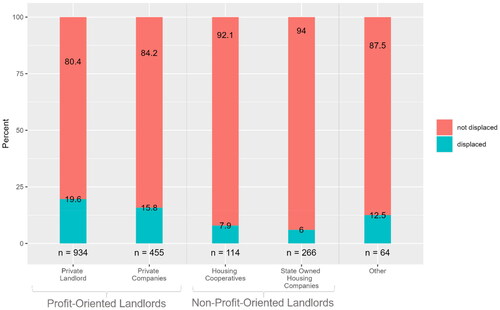
Table 4. Displacement rate by landlord type (based on absolute number of housing units).
Table 5. Displacement triggers experienced by all respondents, by landlord type (multiple responses per respondent possible).
Table 6. Classification of displacement avoidance in nonprofit landlord types.
Table 7. Objectives and management strategies of nonprofit landlord types.