
Figures & data
Figure 1. Number of months homeless during the last 36 months as reported by 307 respondents who answered a question about months homeless during the unsheltered Point-in-Time Count in Nashville/Davidson County in January 2022, and projection to 2,208 people who experience homelessness over three years by weighting each person observed by the inverse of the proportion of time homeless. People who were observed but declined interviews or did not report time homeless are included in the projection, on the assumption that their distribution is the same as that of respondents who did report.
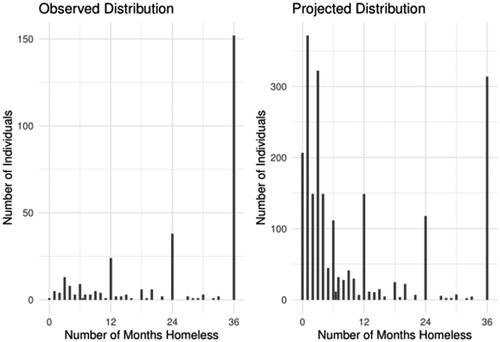
Table 1. Characteristics of 307 respondents who answered a question about months homeless during the unsheltered Point-in-Time Count in Nashville/Davidson County in January 2022, and projection to 2,208 people who experience homelessness over three years by weighting each person observed by the inverse of the proportion of time homeless.