Figures & data
Figure 1. Regional and internal segregation by race for cities in Southern California with between 40,000 and 500,000 residents.
Source: US Census Bureau (Citation2022).
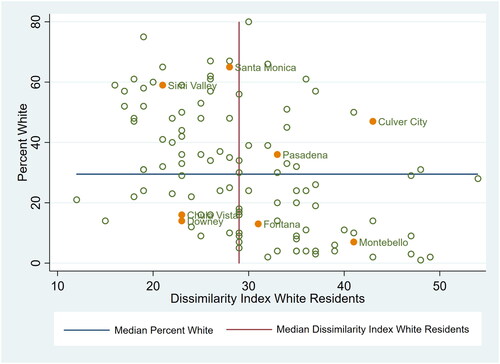
Table 1. Selected characteristics of eight case study municipalities and southern California median.
Table 2. Summary of housing element characteristics for case study cities.
Table 3. Nine sectors of Affimatively Furthering Fair Housing programs.
Table 4. Evaluation of fair housing analysis.
Table 5. Summary of Affirmatively Furthering Fair Housing program characteristics by municipality.
Table 6. Share of programs by Affirmatively Furthering Fair Housing goal.
Table 7. Meaningful impact of Affirmatively Furthering Fair Housing programs by municipality.
Table 8. Distribution of sites for new housing and existing zoning.