Figures & data
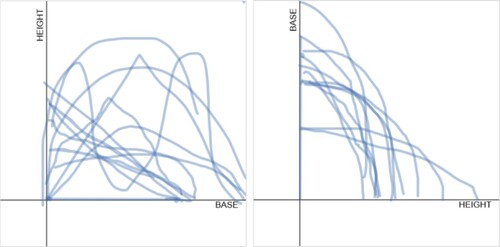
Figure 1. Two graphs representing injective and inverse functions.
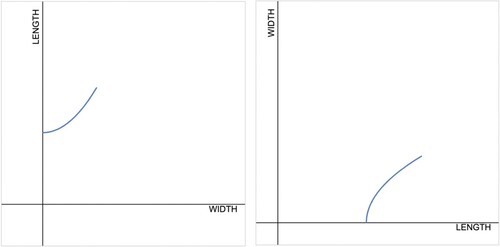
Figure 2. Inverse function relationship.
Figure 3. Screen captures of the dynamic tent animation.
Figure 4. Dynamic tent activity progression.
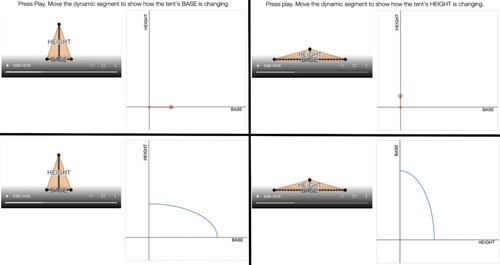
Table 1. Inverse function terminology and associated dynamic tent references.
Figure 5. Dynamic tent graph overlays.