Figures & data
Figure 1. Early embryonic development in G. mellonella. a) TB-RB staining showing the structures involved in early embryonic development in G. mellonella at 12–22 h PO. TB staining time influenced the quality of visualization of the structures during early embryonic development: compare TB staining for 3 min (a, a’, a’’) and 20 min (b, b’, b’’). b) Similarity of results from TB-RB (a, b, c) and H & E (d, e, f) staining. TB-RB staining was invisible by confocal alone unless observed first with DIC (TB staining time = 3 min). Panels show fluorescence (fluo) or confocal (conf) alone, or combined with DIC. Scale bars = 100 µm.
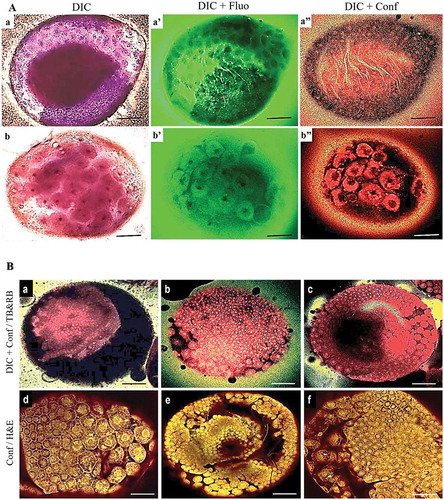
Figure 2. DIC of G. mellonella embryos at 2nd development stage (5–11 h PO) stained by TB-RB (a, b, c) and H & E (d, e, f). a) Energid nuclei during the mitosis prior to cellular blastoderm formation. b) Final cellular blastoderm cells appear hexagonal. c) Blastoderm cells are uniform with darker staining than for H & E. d) Cellular blastoderm embryos stained with H & E. e) Blastoderm cells differentiating to the embryonic area (small cells) as GD and extra-embryonic area (larger and more separated cells that will later form the serosa cuticle (Se)) stained with H & E. f) Blastoderm cells differentiating into a smaller embryonic region and a larger extra-embryonic region stained with H & E. Scale bars = 100 µm (a, b, d, e), 50 µm (c, f).
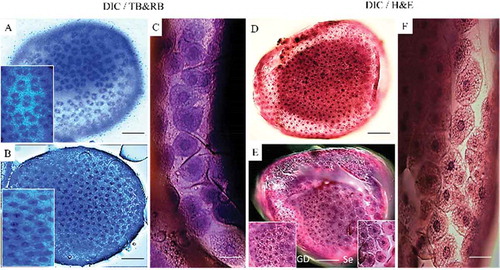
Figure 3. DIC of embryos of G. mellonella during the 3rd developmental stage (12–22.5 h PO) stained with TB-RB. a) GD (white arrowhead) is beginning to separate from serosa cells (black arrows). b) GD (white arrow) after splitting from serosa membrane cells, and vitellophages (white arrowheads) with 1–2 stained nuclei. c) GD sinks and covers vitellophage cells in the center of embryo. Serosal cells have a five-sided appearance. d) Serosal cells were removed manually and blue tissue of GD is surrounding the vitellophage cells. Scale bars = 100 µm.
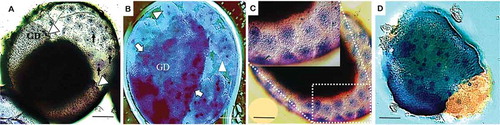
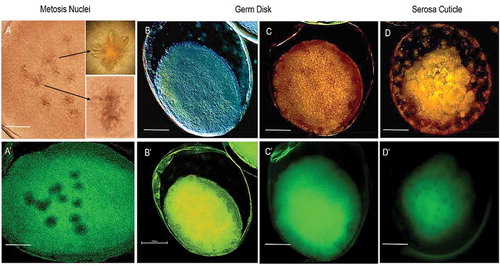
Figure 4. Early embryonic development in G. mellonella stained with CFW. a, a′) At 0–4.5 h PO, embryos exhibit CFW staining of mitotic spindle after fertilization. Image was obtained following staining overnight in CFW. b, b′) Embryos at germ disk stage (12–22.5 h PO) with likely CFW stained chitin in germ disk and serosa. Image was obtained following staining with CFW for 4 h. c, c′, d, d′) Embryos at 12–22.5 h PO stained by CFW (4 h) followed by TB (5 min). Fluorescence + DIC (a′, b′, c′, d′), fluorescence + confocal (C, D), or DIC alone (A, B). Scale bars = 100 µm.