
Figures & data
Table 1. Characteristics of disasters included in our analysis sample.
Table 2. Size and scope of disasters included in our analysis.
Table 3. Definitions of financial health outcomes.
Table 4. Characteristics of people living in areas hit by a natural disaster, by disaster size.
Figure 1. Change by disaster group and year(s) after disaster: Natural disasters lead to declines in credit scores, and these declines increase over time. Notes. Values represent estimates of average differences in credit scores between individuals affected by the indicated disaster (or set of disasters) and matched individuals from unaffected areas. Effects are estimated separately for each disaster for each of the four years following the disaster.
*p < 0.1, **p < 0.05, ***p < 0.01. Source: Authors’ calculations based on credit bureau, FEMA, and ACS data.
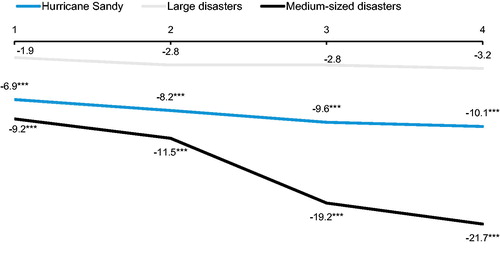
Table 5. Effect of natural disasters on credit score.
Table 6. Effect of natural disasters on credit score by pre-disaster credit score groups.
Table 7. Effect of natural disasters on credit score by age groups.
Table 8. Effect of natural disasters on credit score by ZIP code racial and ethnic composition.
Table 9. Effect of natural disasters on mortgage delinquencies (60 days past due) and foreclosures.
Table 10. Effect of Hurricane Sandy on mortgage delinquencies and foreclosures by pre-disaster credit score groups.
Table 11. Effect of Hurricane Sandy on mortgage delinquencies and foreclosures by age groups.
Table 12. Effect of natural disasters on mortgage delinquencies and foreclosures by ZIP code racial and ethnic composition.
Table 13. Effect of natural disasters on debt in collections.
Table 14. Effect of natural disasters on debt in collections by pre-disaster credit score groups.
Table 15. Effect of natural disasters on having a credit card and credit card balance.
Table 16. Effect of natural disasters on having a credit card and credit card balance by pre-disaster credit score groups.
Table 17. Effect of Hurricane Sandy on selected credit and debt outcomes, regression model.