Figures & data
Table 1. NFIP deductible menu for October 2008 – October 2019.
Table 2. Owner-occupied single-family dwellings, NFIP policy effective 01/01/2009–06.
Table 3. 2015 summary statistics for matched policies (2013–2019).
Figure 1. Total SFHA policies by deductible (January 2010 – July 2019).
Note. presents the total number of NFIP flood insurance policies in effect by month for owner-occupied single-family dwellings in SFHAs. This stacked line graph makes obvious a) the raising of the minimum deductible from $500 to $1000, b) the raising of the minimum from $1,000 to $1,250, c) the availability of the $1,500 deductible, and d) the raising of the maximum deductible from $5,000 to $10,000 on April 1, 2015. The figure also reveals the considerable drop in the number of policies in effect during the two-year period following the beginning (October 2013) of the implementation of the Biggert-Waters Flood Insurance Reform Act of 2012.
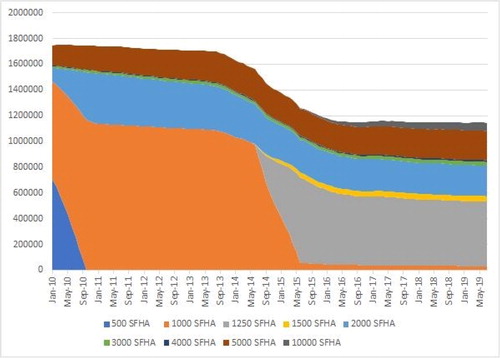
Figure 2. Total non-SFHA policies by deductible (January 2010 – July 2019).
Note. presents the total number of National Flood Insurance Program policies by deductible ($500, $1,000, $1,250, $1,500, $2,000, $3,000, $4,000, $5,000, or $10,000) in effect by month from January 2010 through July 2019 for owner-occupied single-family dwellings that are outside of Special Flood Hazard Areas. This stacked line graph makes obvious a) the raising of the minimum deductible from $500 to $1000, and b) the raising of the minimum from $1,000 to $1,250 for building coverage greater than $100,000. The figure is dominated by Preferred Risk Policies which constitute over 90% of the non-SFHA policies in our sample.
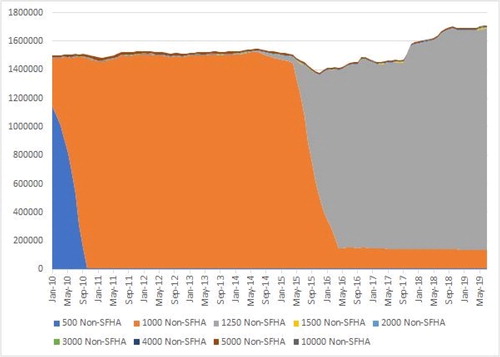
Figure 3. Minimum deductible choice in SFHAs percentage of owner-occupied SFDs.
Note. presents the time series for the percentage of SFHA policies in effect that have the minimum deductible available for the given properties. The minimum deductible option depends on a variety of factors, including the amount of building coverage and whether the property is pre-FIRM, post-FIRM, or part of the Emergency Program. For more details regarding the menu of deductible options over this time frame and what minimum deductibles are applied, see .
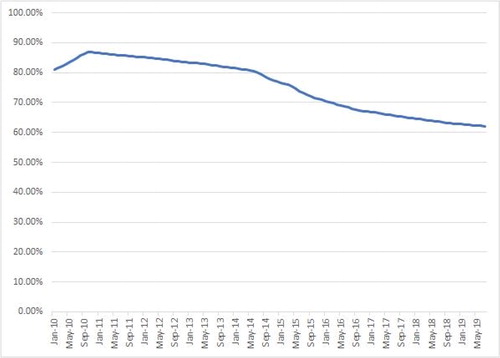
Figure 4. Maximum deductible choice in SFHAs percentage of owner-occupied SFDs.
Note. presents the time series for the percentage of SFHA policies in effect that have the maximum deductible available. Prior to April 2015, the maximum deductible option for SFHA properties was $5,000, and beginning in April 2015, a new maximum of $10,000 was made available. The drop in the percentage of policies at the maximum deductible in April 2015 reflects this change, and the slow take-up of this new maximum is demonstrated by the subsequent increase.
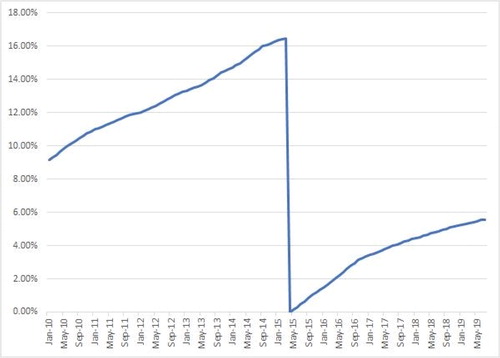
Figure 5. $5,000 and $10,000 deductibles in SFHAs: Percentage of policies in effect before and after April 1, 2015 owner-occupied SFDs.
Note. presents the time series for the percentage of SFHA policies that had either a $5,000 or $10,000 deductible. This plot is identical to the one in up until the increase to the maximum deductible in April 2015. For the subsequent period, the percentage includes policies with either the old maximum of $5,000 or the new maximum of $10,000.
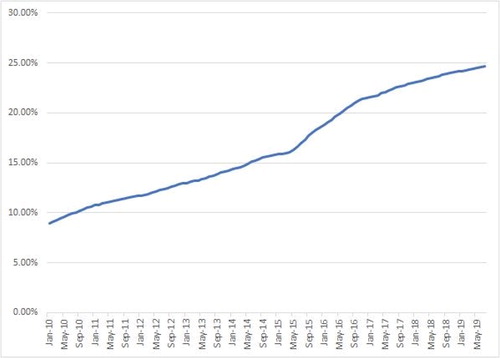
Figure 6. $5,000 and $10,000 deductibles in SFHAs: Count of policies in effect before and after April 1, 2015 owner-occupied SFDs.
Note. presents the total counts for SFHA policies with either $5,000 or $10,000 deductibles. This plot demonstrates the reduction in policies following the implementation of Biggert-Waters in October 2014, and then the take-up of the $10,000 deductible option after it was made available in April 2015. After the addition of the new maximum option, it can be seen that the majority of the policy growth since 2015 can be attributed to the $10,000 option.
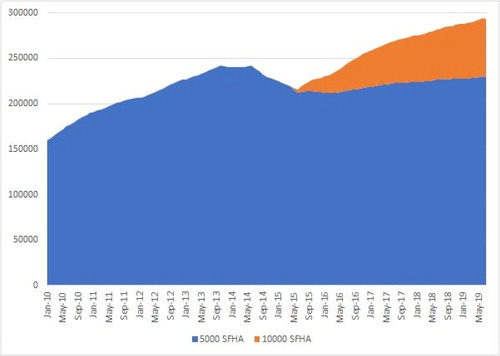
Figure 7. Distribution of deductibles by year (for our 252,280 matched policies).
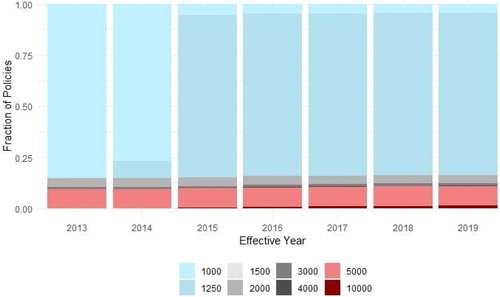
Figure 8. Fraction of individuals at the $5k deductible who chose to switch to the $10k deductible (252,280 matched policies).
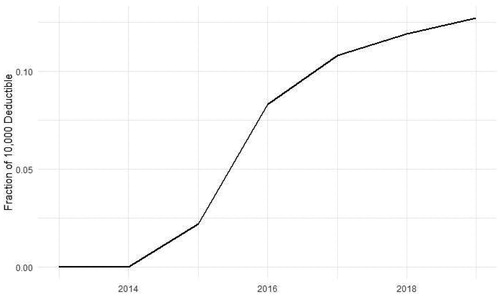
Figure 9. Premiums paid by those at the maximum deductible (252,280 matched policies).
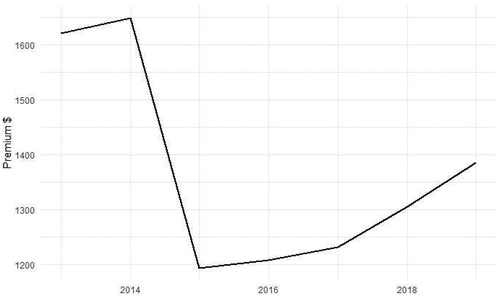
Figure 10. Selection of the maximum deductible by risk level.
Note. plots the estimates of β from EquationEquation (1)(1)
(1) where the independent variable is the binned flood insurance premium for a policy with the maximum coverage and minimum deductible. The estimates for each bin indicator are plotted along with the corresponding 95% confidence interval derived from the standard errors, which are clustered at state level. The sample includes all the SFHA policies in the main analytic sample.
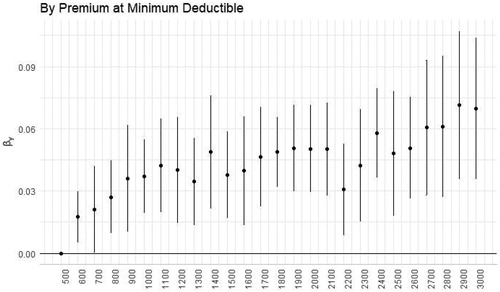
Figure 11. Selection of the maximum deductible by income level.
Note. plots the estimates of β from EquationEquation (1)(1)
(1) where the independent variable is the binned median income in the corresponding census tract. The estimates for each bin indicator are plotted along with the corresponding 95% confidence interval derived from the standard errors, which are clustered at state level. The sample includes all the SFHA policies in the main analytic sample.
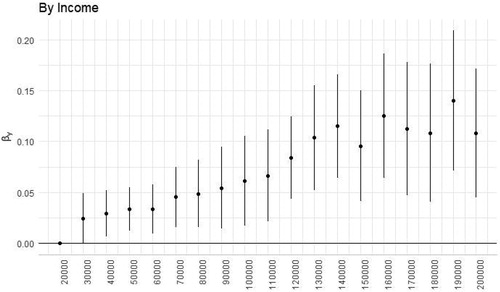
Table 5. Logistic regression models for selecting the maximum deductible option.
Table 4. Linear probability models for selecting the maximum deductible option.
Table 6. Linear probability models for switching from $5,000 to $10,000 deductible.
Table 7. Logistic regression models for switching from $5,000 to $10,000 deductible.
Figure 13. Selection of the maximum deductible by claim history.
Note. plots the estimates of β from EquationEquation (1)(1)
(1) where the independent variable is the binned mean percentage policies with claims in the previous three years. The estimates for each bin indicator are plotted along with the corresponding 95% confidence interval derived from the standard errors, which are clustered at state level. The sample includes all the SFHA policies in the main analytic sample.
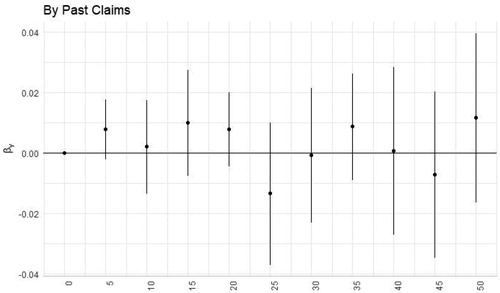
Figure 14. Likelihood of increasing deductible to new maximum by risk level.
Note. plots the estimates of β from EquationEquation (2)(2)
(2) where the independent variable is the binned flood insurance premium for a policy with the maximum coverage and minimum deductible. The estimates for each bin indicator are plotted along with the corresponding 95% confidence interval derived from the standard errors, which are clustered at state level. The sample includes all the SFHA policies in the main analytic sample that are active from 2013 to 2019 and are observed to have a $5,000 deductible prior to 2015.
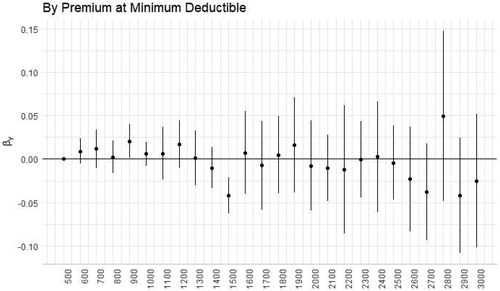
Figure 15. Likelihood of increasing deductible to new maximum by income level.
Note. plots the estimates of β from EquationEquation (2)(2)
(2) where the independent variable is the binned median income in the corresponding census tract. The estimates for each bin indicator are plotted along with the corresponding 95% confidence interval derived from the standard errors, which are clustered at state level. The sample includes all the SFHA policies in the main analytic sample that are active from 2013 to 2019 and are observed to have a $5,000 deductible prior to 2015.
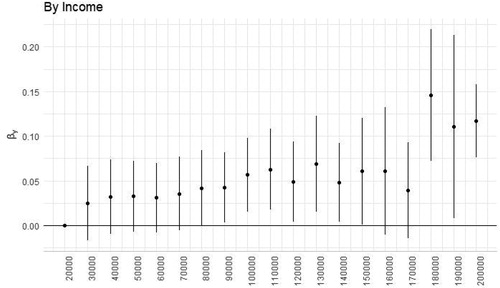
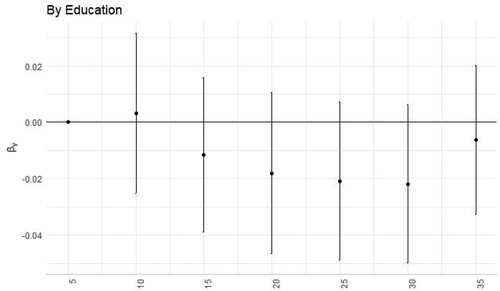
Figure 16. Likelihood of increasing deductible to new maximum by education level.
Note. plots the estimates of β from EquationEquation (2)(2)
(2) where the independent variable is the binned percentage of the population with a college degree at the census tract level. The estimates for each bin indicator are plotted along with the corresponding 95% confidence interval derived from the standard errors, which are clustered at state level. The sample includes all the SFHA policies in the main analytic sample that are active from 2013 to 2019 and are observed to have a $5,000 deductible prior to 2015.
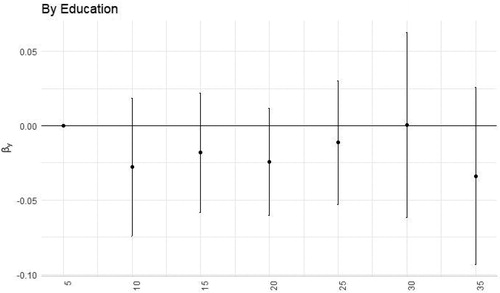
Figure 17. Likelihood of increasing deductible to new maximum by claim history.
Note. plots the estimates of β from EquationEquation (2)(2)
(2) where the independent variable is the binned mean percentage policies with claims in the previous three years. The estimates for each bin indicator are plotted along with the corresponding 95% confidence interval derived from the standard errors, which are clustered at state level. The sample includes all the SFHA policies in the main analytic sample that are active from 2013 to 2019 and are observed to have a $5,000 deductible prior to 2015.
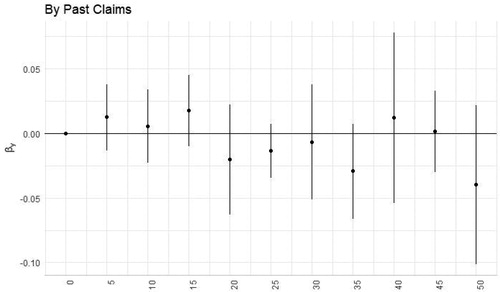
Figure 12. Selection of the maximum deductible by education level.
Note. plots the estimates of β from EquationEquation (1)(1)
(1) where the independent variable is the binned percentage of the population with a college degree at the census tract level. The estimates for each bin indicator are plotted along with the corresponding 95% confidence interval derived from the standard errors, which are clustered at state level. The sample includes all the SFHA policies in the main analytic sample.