Figures & data
Figure 1. Participant recruitment.
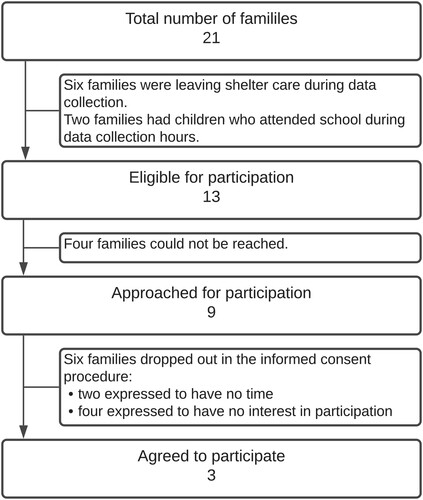
Table 1. Participant characteristics.
Figure 2. Visual representation of the data collected in Phase A (baseline) and Phase B (intervention) on need satisfaction with mean levels for both phases.
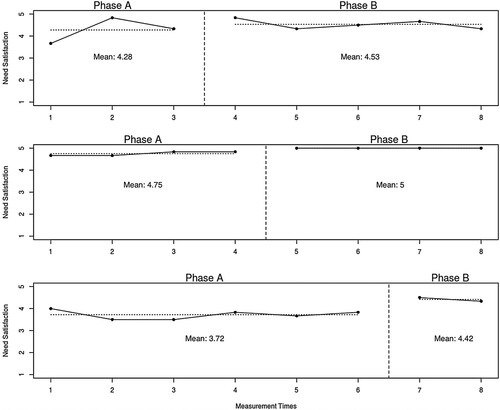
Figure 3. Visual representation of the data collected in Phase A (baseline) and Phase B (intervention) on need frustration with mean levels for both phases.
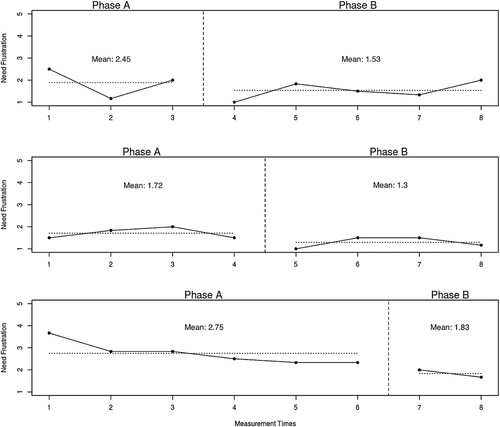
Table 2. Test-statistics (measured as the absolute difference between the phase means), effect sizes (measured by standardized mean difference), PEMscores (the percentage of the data that was higher or lower -following hypotheses- in phase B than the median of phase A), NAPscores (the percentage of non-overlapping data between all phase A versus all phase B datapoint comparisons), the randomization test’s p-values, and combined p-values.
Figure 4. Visual representation of the data collected in Phase A (baseline) and Phase B (intervention) on subjective positive affect with mean levels for both phases.
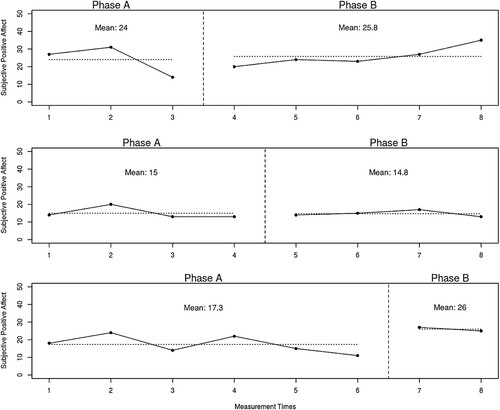
Figure 5. Visual representation of the data collected in Phase A (baseline) and Phase B (intervention) on subjective negative affect with mean levels for both phases.
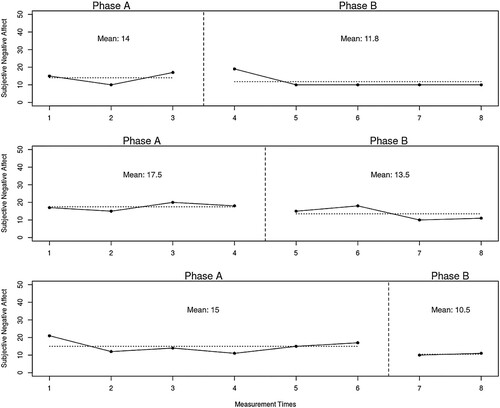
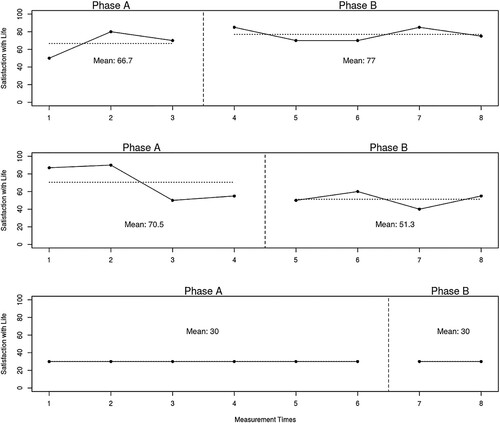
Figure 6. Visual representation of the data collected in Phase A (baseline) and Phase B (intervention) on satisfaction with life with mean levels for both phases.