Figures & data
Figure 1. Notation illustrated. Lines indicate mean potential outcomes under three potential treatment scenarios. Circles indicate observable outcomes for a participant who discontinues treatment at visit .
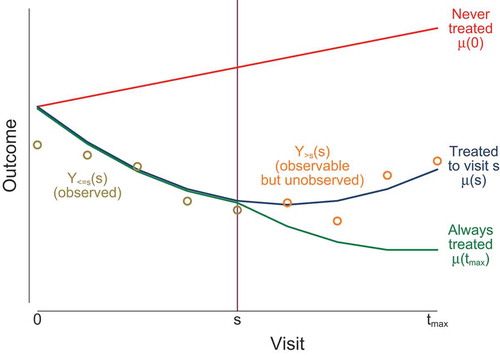
Table 1. Imputation distribution of for
given randomisation
, past
and treatment discontinuation visit
, under various reference-based imputation methods with control arm as reference (Carpenter et al. Citation2013) and under the causal model.
is a ‘carry-forward’
matrix containing
columns of zeroes and a final column of ones, so that
is a column vector containing
copies of
.
Table 2. Simulation study with or
: estimates of treatment effect at visit 2 using complete data, causal model imputation and RBI imputation.
in all cases.
means
.
Table 3. Simulation study: average standard error (empirical standard error) for the treatment difference at the final visit using complete data, causal model imputation and RBI imputation. and
as in .
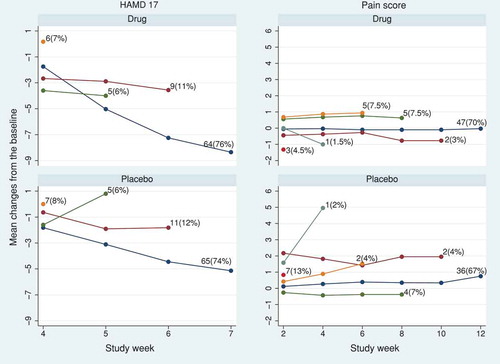
Figure 2. HAMD17 and pain score data sets: observed mean profile according to the visit at which treatment was discontinued in the active and placebo arms.

Table 4. HAMD17 and pain score data: estimated treatment effect at the final visit using standard multiple imputation with 100 imputations, mixed model for repeated measures (MMRM) and RBI methods.
Figure 3. HAMD17 and pain score data sets: tipping point analysis for the estimated treatment effect at the final visit using causal model (5). The model has a constant treatment effect after treatment discontinuation, equal to fraction of the treatment effect at treatment discontinuation. The horizontal solid and dotted lines represent the treatment estimates and their pointwise 95% CI, respectively. The vertical solid line corresponds to
such that p-value
in the left-hand side of the line (tipping point).
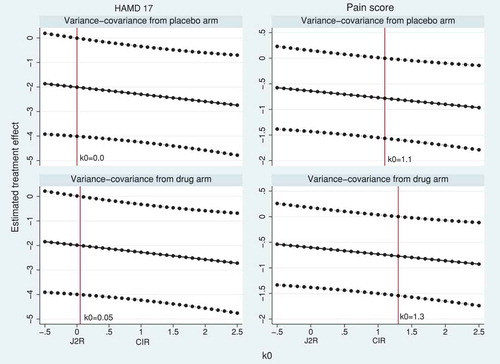
Figure 4. HAMD17 and pain score data sets: tipping point analysis for the estimated treatment effect at the final visit using causal model (6). The model has the treatment effect decaying exponentially after treatment discontinuation, by a ratio for each visit. The horizontal solid and dashed lines represent the treatment estimates and their pointwise 95% CI, respectively. The tipping point is not attained in the range
.