
Figures & data
Table 1. Two doses, two looks, common control and normally distributed endpoint.
Table 2. Critical boundary with two treatments and two looks, any distribution.
Table 3. Type I error control with two doses and with two looks.
Table 4. Point estimates and confidence interval coverage.
Figure 1. Scenario 1 illustration.
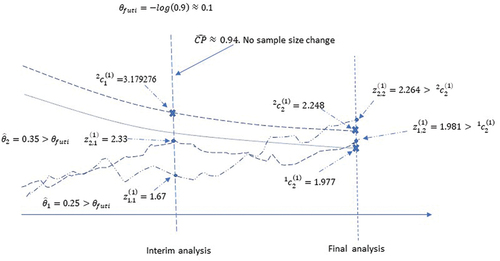
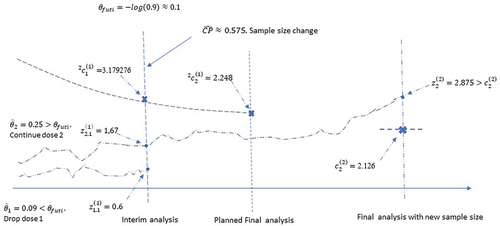
Figure 2. Scenario 2 illustration.
Supplemental material