
Figures & data
Figure 1. eCDF/ePDF curves of target COA (WOMAC pain subscale) change from baseline by anchor change.
eCDF empirical cumulative distribution function, ePDF empirical probability density function, COA clinical outcome assessment.
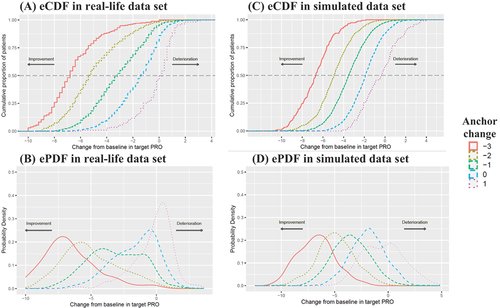
Table 1. Descriptive statistics of the change from baseline in WOMAC pain subscale for each category of the anchor change.
Figure 2. Estimates of within-patient change in target COA (WOMAC pain subscale) by model-based and eCDF methods.
COA clinical outcome assessment, eCDF empirical cumulative distribution function, eCDF_mean_visit mean of eCDF-derived means by visit, eCDF_median_visit median of eCDF medians by visit, PRO patient-reported outcome, RMM_cat/RMM_con repeated measures model with a categorical/continuous anchor change.
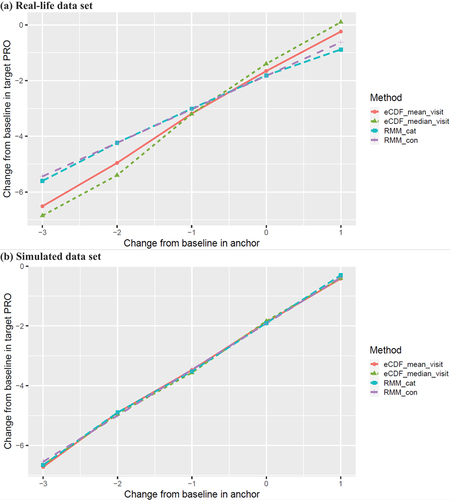
Table 2. Estimates of within-patient change in WOMAC pain subscale by model-based and eCDF methods in the real-life data set.
Figure 3. Within-patient change in target COA (WOMAC pain subscale) given 1-level anchor change (bootstrapping and parametric model results).
COA clinical outcome assessment, eCDF empirical cumulative distribution function, PRO patient-reported outcome, RMM repeated measures model. The yellow dot and gray line indicate a point estimate and corresponding 95% confidence interval, respectively.
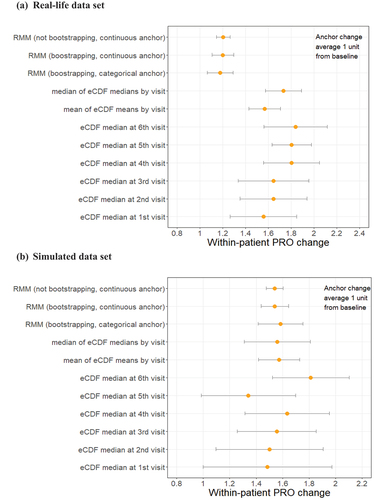
Table 3. Estimates of within-patient change in WOMAC pain subscale by model-based and eCDF methods in the simulated data set.