
Figures & data
Table 1. Summary of the analysed destination competitiveness literature reviews (N/A represents not available).
Figure 1. The proposed computational literature review framework for achieving the conceptual goal of envisioning.
Figure 2. Distribution of destination competitiveness publications over time.
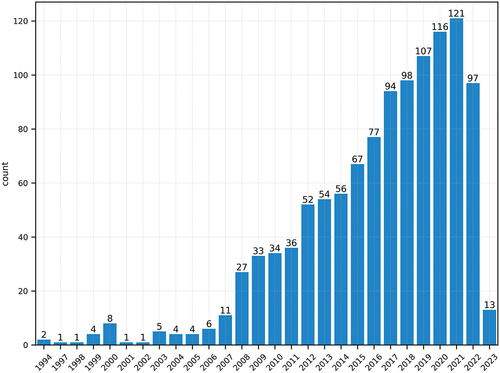
Figure 3. Distribution of publication among different sources.
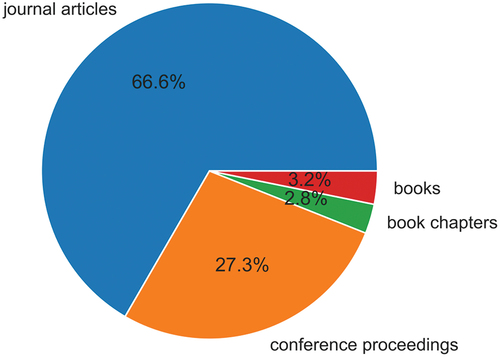
Figure 4. Distribution of the number of publications in the top 15 journals with the most publications on destination competitiveness.
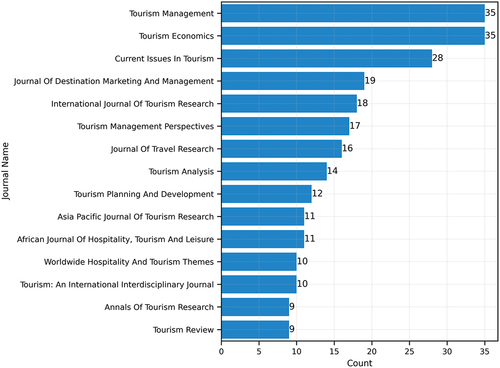
Table 2. Top-5 publications ranked by citations.
Table 3. Top-10 researchers ranked by corpus specific H-Index and citations.
Table 4. Results of the detected topics and themes.
Table 5. The popularity of the detected topics and themes.
Figure 5. Distribution of the topics and themes from 2021 to 2023.
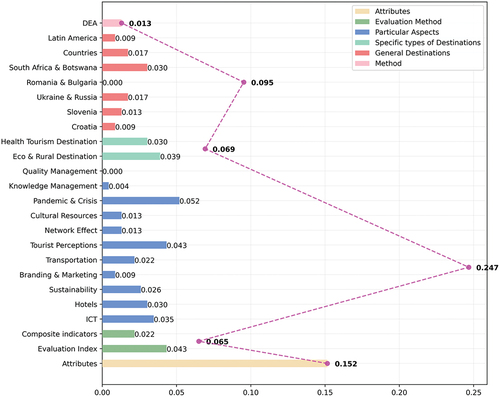
Table 6. Trends of the research topics and themes from 1994 to 2022 (ns p > 0.05; *p ≤ 0.05; **p ≤ 0.01; ***p ≤ 0.001).