Figures & data
Figure 1. A stylized image showing the design research process of the video.
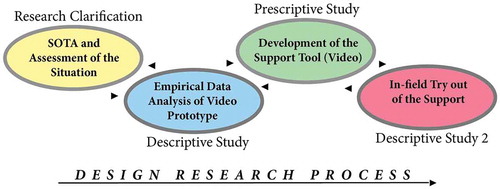
Figure 2. A screen-shot from the antipredator fence instructional video, showing the fence-building instructor in action as he shows how a “parallelogram” is constructed. To the right, macroscaffolding (“Chapters”) in the form of text and graphics are visible.
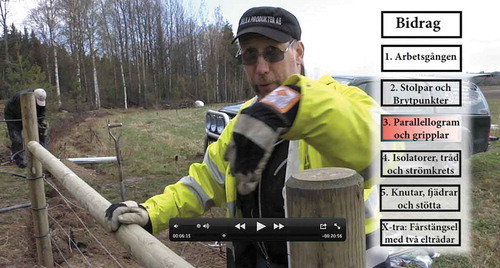
Figure 3. A stylized image showing that the video’s content is structured in accordance with key themes and their associated communication ideals.
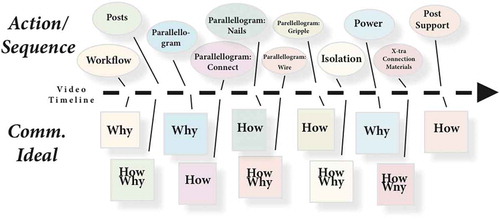
Table 1. Table shows video sequences’ content and the associated focus group’s feedback, and, in turn, how this relates to live-action affordances and possible design measures.
Table 2. Summaries of fence construction teams’ feedback from the in-field try-out, some of which relate to specific video sequences. In the table, this is in turn related to certain live-action affordances and possible design measures.
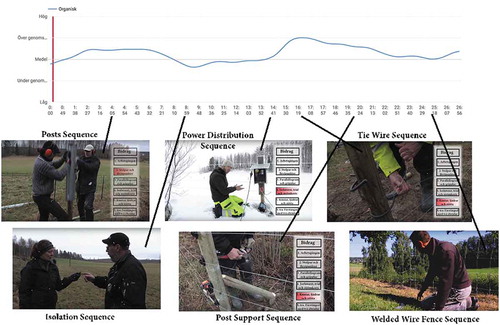
Figure 4. Figure shows the YouTube analytics’ viewers’ relative attention graph. The figure consists of a screen-shot from the YouTube analytics page (in Swedish) and, below, added stills from some of the video’s sequences.