Figures & data
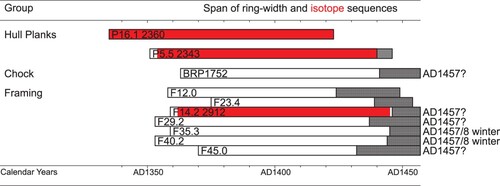
Figure 1. Subsampling of the conserved dendrochronology framing timber sample F14.2_2912. The extracted lath was then cut using a scalpel under magnification to collect the latewood from each annual ring (photo: R.J. Bale).
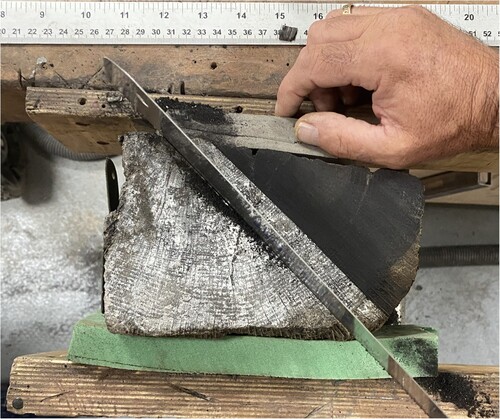
Figure 2. Bar diagram of original ring-width series (black outline with sapwood shaded grey) and isotope series (red) for the two hull plank samples, correlation between these two isotope series (Student’s t = 5.47), construction of two-timber isotope mean, and correlation of isotope series from framing samples against it (Student’s t = 6.51), and construction of three-timber isotope mean. Framing ring-width series absolutely dated with a possible bark edge date of AD 1457B? (image: N. Nayling).
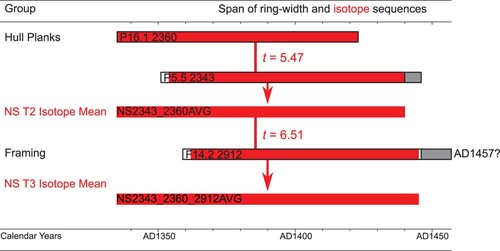
Table 1. Results of crossdating between the oxygen isotope individual samples series, site mean and regional records. Inter-series comparisons and associated statistics are presented for the period of full overlap at the point of strongest match. Comparisons between the site mean and the regional chronologies adopt the dating protocols of Loader et al. (Citation2019) and report Bonferroni-corrected probabilities.
Figure 3. Visual comparison of the oxygen isotope series F114.2_NS2912 and the isotope mean of dated timbers P5.5_NS2343 and P16.1_NS2360, positioned at the date of best match AD 1335 to AD 1445 (Student’s t = 6.51 1/p > 1 Million, IF >1000). Twelve annual rings (not measured isotopically) at the end of NS2912 with possible bark edge imply a felling date of AD 1457B? (image: N.J. Loader)
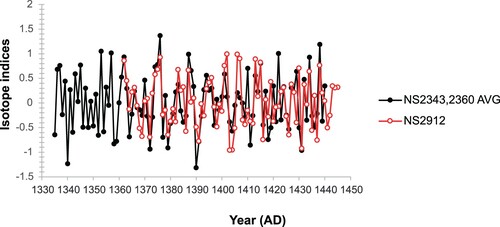
Figure 4. Bar diagram of the absolute dating of the original ring-width series (black outline with sapwood shaded grey) and isotope series (red) for the two hull plank samples, and framing timbers group NewportT7 and chock BRP_1752 indicating absolute felling dates (image: N. Nayling).