Figures & data
Figure 1. Detailed flow diagram for semi-automated social media analysis.
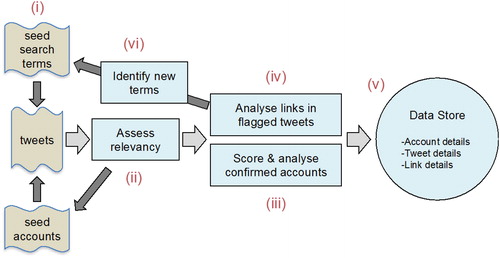
Table 1. Description of final dataset.
Table 2. Location and identification of Twitter accounts.
Figure 2. Cumulative suspension rate for all accounts in database.
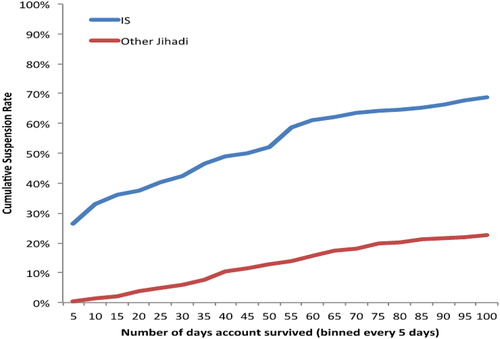
Figure 3. Cumulative suspension rate for accounts eventually suspended.
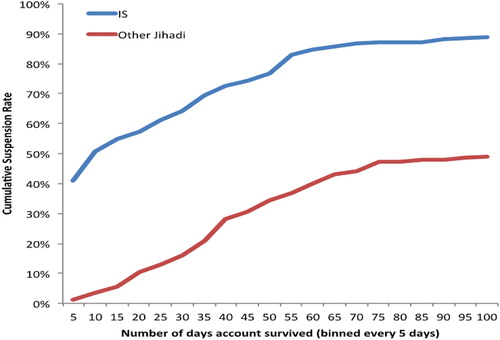
Figure 4. Case study of intervention effectiveness.
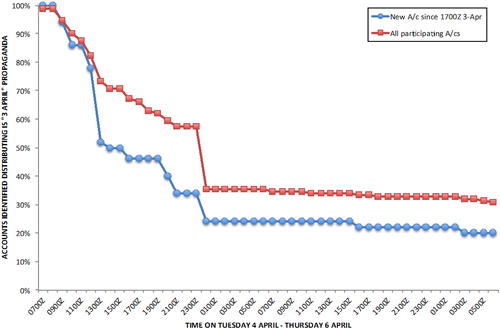
Table 3. Median number of tweets, followers, and friends for accounts not yet suspended.
Table 4. Changes in account name types due to disruption activity.*
Table 5. Top 10 other platforms (based on out-links from Twitter).
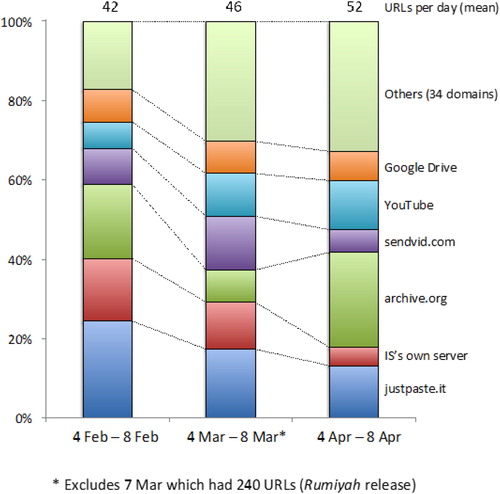
Figure 5. Destinations of official IS propaganda: Number of URLs and URL destinations February to April 2017.