
Figures & data
Figure 1. Residential patterns in Jerusalem.
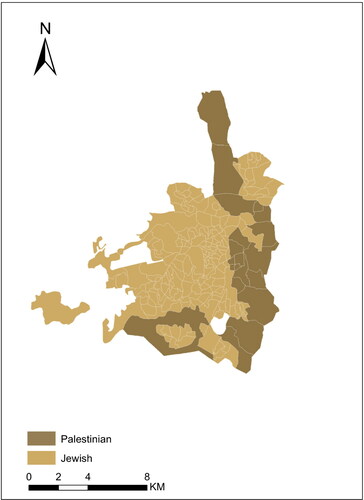
Figure 2. Riots in Jerusalem, 2013–2015.
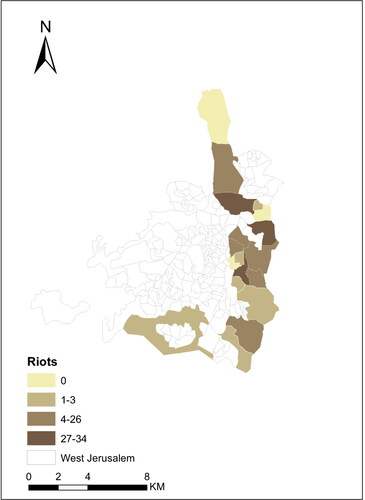
Table 1. Summary statistics of the main variables.
Table 2. Summary statistics of proxies for cohesion.
Table 3. Factor analysis on social cohesion indicators.
Figure 3. Spatial autoregressive model (police data). In all models, thick lines denote significance levels of p < .05 and the thin extensions denote significance levels of p < .1.
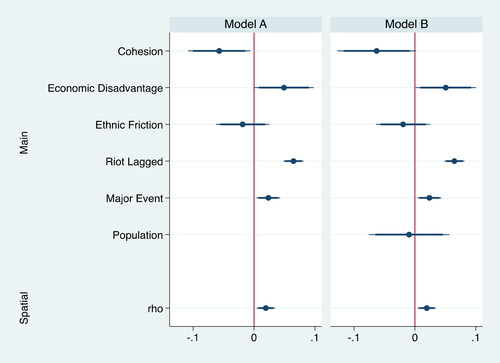
Table 4. Random effects with clustered errors model (police data).
Figure 4. Interaction terms on all datasets.
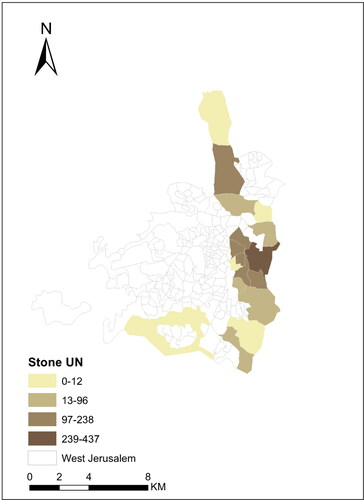
Figure 5. Riots in Jerusalem, 2013–2015 (United Nations data).
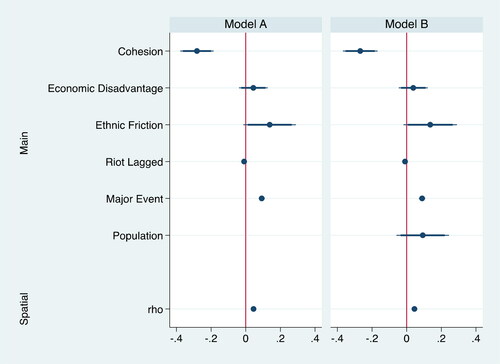
Figure 6. SAR model—United Nations stone throwing.
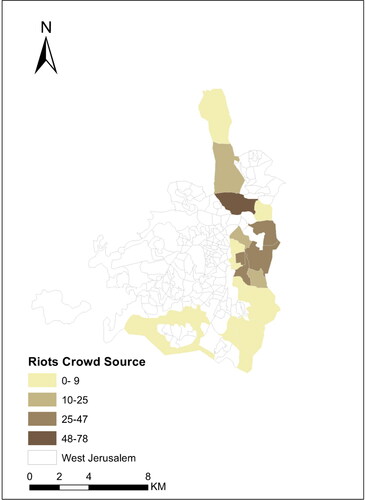
Figure 7. Riots in Jerusalem, 2013–2015 (crowd sourced).
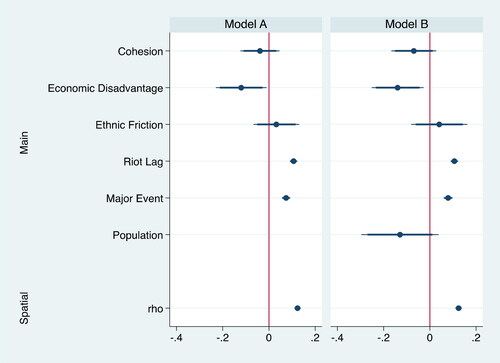
Figure 8. SAR model—Crowd-sourced riots.
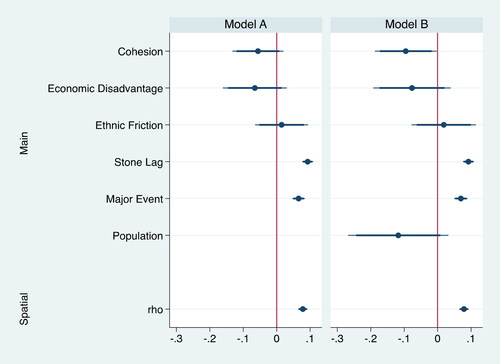
Figure 9. SAR model—Crowd-sourced stone throwing.
