
Figures & data
Figure 1. Distribution of dependent variable: Fear of terrorism.
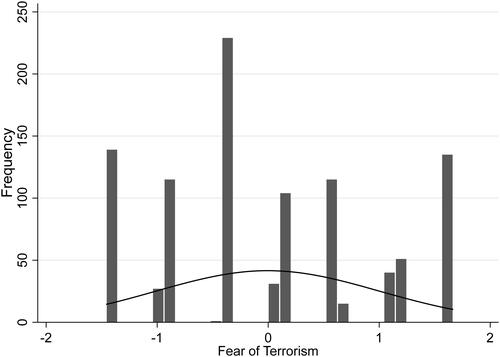
Figure 2. Distribution of independent variable: Use of online websites and social media to obtain news.
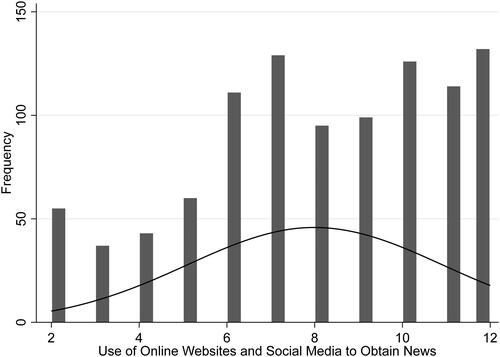
Figure 3. Distribution of mediating variable: Conspiratorial beliefs (factor variable).
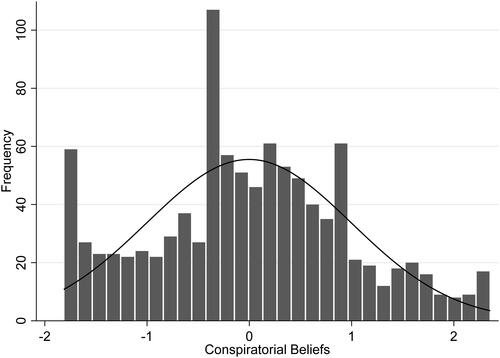
Figure 4. Marginal effects of use of online websites and social media to obtain news and fear of terrorism.
Fear of Terrorism. Continuous variable constructed using factor analysis of two survey questions: (1) How afraid are you of the following events: A terrorist attack? Reponses: very afraid, afraid, slightly afraid, not afraid (inverted); (2) How afraid are you of being the victim of the following crimes: terrorism? Responses: very afraid, afraid, slightly afraid, not afraid (inverted).
Use of Online Websites and Social Media for News. Additive index constructed using two survey questions: (1) How often do you read online news websites? Responses: every day, most days, once or twice a week, once or twice a month, less than once a year, never (inverted): (2) How often do you get news from social media?: Responses: every day, most days, once or twice a week, once or twice a month, less than once a year, never (inverted).
Controls: Model includes the following controls: frequency of getting news from national newspaper, local newspaper, network television news, local television news, CNN, MSNBC, Fox News, talk radio, daytime talk television; age; gender; education level; household income level; employment status; race/ethnicity; religion; literal interpretation of Bible; U.S. region of residence; partisan identification; political ideology; duration of survey.
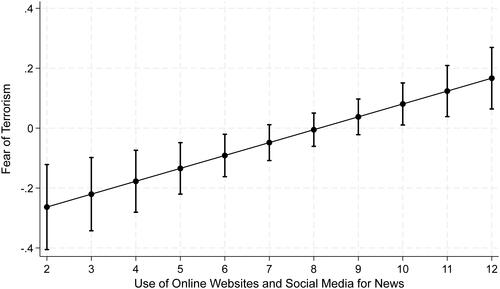
Figure 5. Coefficient plots, full model.
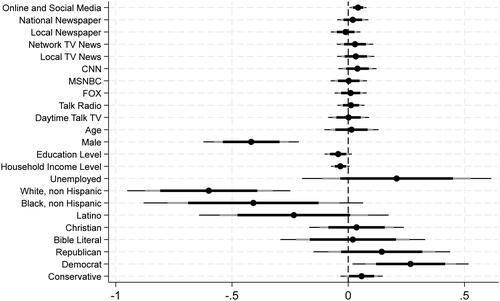
Figure 6. Coefficient plots: Types of news consumption and fear of terrorism 95, 99, 99.9% confidence level noted.
Note. All covariates included in model. Covariates included but not displayed (to conserve space): age; gender; education level; household income level; employment status; race/ethnicity; religion; literal interpretation of Bible; U.S. region of residence; partisan identification; political ideology; duration of survey.
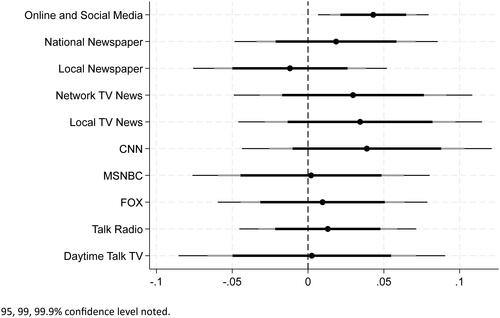
Figure 7. Mediation analysis.
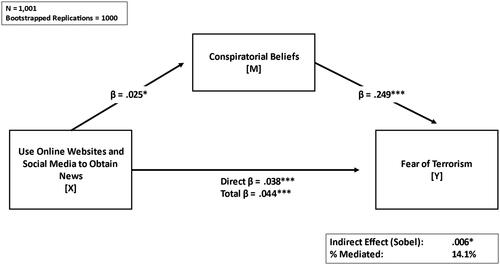
Table A1. Descriptive statistics.
Table A2. Use of social media and online websites for news and fear of terrorism, full model results.
Table A3. Estimating separately use of social media and online websites for news and fear of terrorism.
Table A4. Mediation results, estimating separately use of social media and online websites for news and fear of terrorism.