
Figures & data
Table 1 Retention rate across survey waves, by sample source
Figure 1. Measurement model for the four endogenous variables in our study. Large circles indicate latent variables; squares are indicators; smaller circles are the error term unique to each indicator. Paths are drawn between each latent variable and its indicators; curved arrows between error terms indicate that an indicator’s error term at Wave 2 (W2) was allowed to be correlated with that indicator’s error term at Wave 3 (W3); curved arrows between latent variables indicate that we allowed each endogenous variable to be correlated with another within and across the two survey waves. Question wording for the indicators is included in supplemental Appendix A.
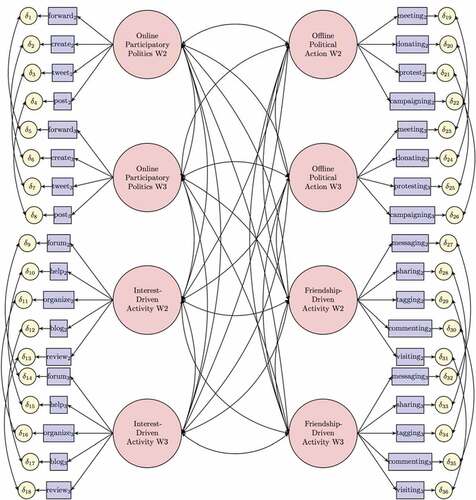
Figure 2. Simplified representation of the cross-lagged model used to test the relationships between political participation and online activity. Straight arrows signify the effects of each variable at Wave 2 (W2) on the variables at Wave 3 (W3); curved arrows indicate that the variables at W2 are allowed to covary with one another, without imposing any assumptions about the causal relationships between them.
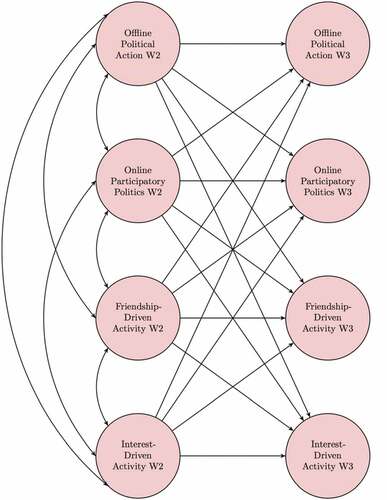
Table 2 Estimated effects of Wave 2 endogenous variables on Wave 3 endogenous variables, using longitudinal structural equation models
Table 3 Estimated effects of Wave 2 endogenous variables and network size on Wave 3 endogenous variables, using longitudinal structural equation models