
Figures & data
Table 1 Logistic regression model predicting likelihood of answering TTIP question correctly.
Figure 1. Predicted probability of knowing what TTIP means with increasing levels of ZML consumption per month.
Figure 2. Structural equation model predicting the relationships between satire exposure, the feeling of being informed, and subsequent indicators of the public agenda.
Note: For reasons of clarity, covariances that were specified between all exogenous variables and error terms of the endogenous variables were not visualized. *** p < .001. ** p < .010. * p < .050.
Table 2 ARIMA model predicting the salience of TTIP on the public, media, and political agenda.
Figure 3. Visual overview of time series: public (dashed, black), media (solid, red) and political agenda (dotted, blue).
Note: Zondag met Lubach (ZML) broadcasts on TTIP aired in 2015, weeks 12 and 41.
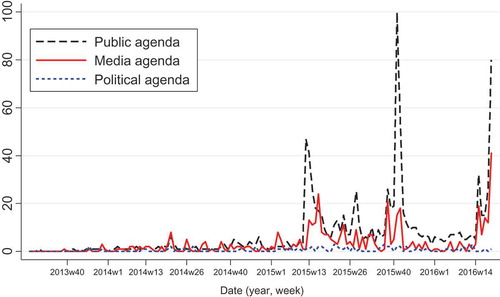
Figure A1. Visual illustration of different decay functions per week.
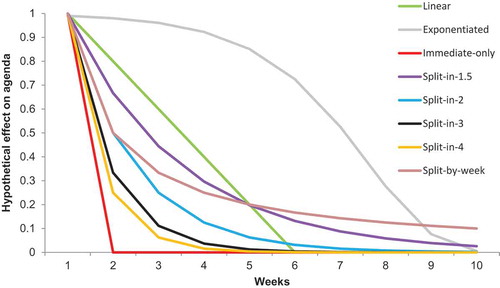
Table A1 Model fit of ARIMA models predicting, respectively, the public, media, or political agenda while applying different decay functions.