
Figures & data
Figure 1. Structural equation models of in-lab voting decisions on ballot measures by average Ngram score and reported processing fluency – Study 1. Vote choice was coded ordinally in both models; the left panel shows the oppose (0), abstain (1), support (2) coding scheme, while the right panel shows the abstain (0), oppose (1), support (2) coding scheme. Estimates, standard errors, confidence intervals, and effect sizes were calculated with maximum likelihood estimation. Standard errors were clustered at the subject-level (N = 120). The path between NGram scores and Fluency supports the hypothesized relationship from H1 and that the indirect path between NGram scores and Vote Choice is consistent with H2 regardless of the ordering of the Vote Choice DV.
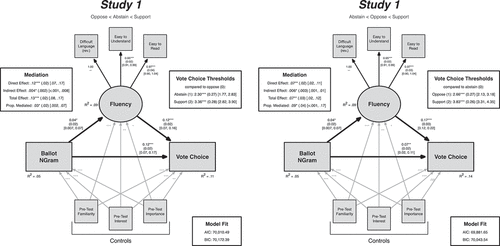
Figure 2. Structural equation modeling results with real-world voting outcomes for Studies 1 (left panel) and 2 (right panel). Processing fluency was measured among lab participants in these models. Estimates shown with standard errors in parentheses and 95% confidence intervals in brackets. As these figures indicate, the indirect path between ballot wording and real-world passage rates, mediated through fluency, was supported across both studies.
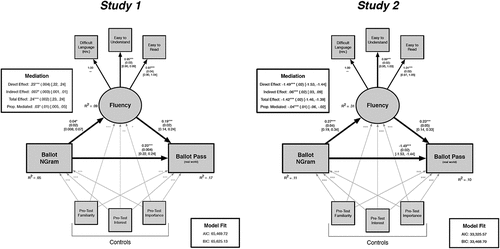
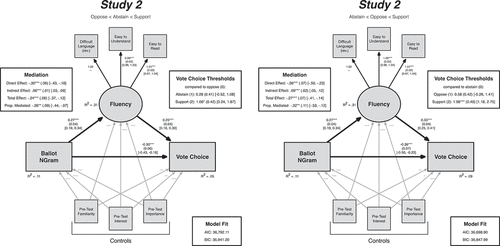
Figure 3. Structural equation models of in-lab voting decisions on ballot measures by average Ngram score and reported processing fluency – Study 2. Vote choice was coded ordinally in both models; the left panel shows the oppose (0), abstain (1), support (2) coding scheme, while the right panel shows the abstain (0), oppose (1), support (2) coding scheme. Estimates, standard errors, confidence intervals, and effect sizes were calculated with maximum likelihood estimation. Standard errors were clustered at the subject-level (N = 120). The path between NGram scores and Fluency supports the hypothesized relationship from H1 and that the indirect path between NGram scores and Vote Choice is consistent with H2 regardless of the ordering of the Vote Choice DV.
Supplemental Material
Download MS Word (42.6 KB)Data availability statement
The data described in this article are openly available in the Open Science Framework at https://osf.io/2q7cw/?view_only=15f95ed1a4a476099d0244b7dfba919.