
Figures & data
Table 1. Mixed linear regression model explaining perceived headline accuracy using the PCA factors for media use (surveys 1 and 2 combined).
Figure 1. Perceived accuracy of true vs. false headlines by use of professional and social media for getting news about the election (surveys 1 and 2 combined).
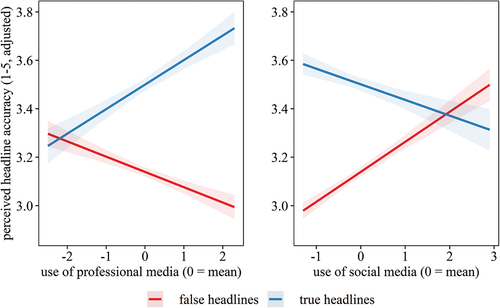
Table 2. Mixed linear regression models explaining intention to share headlines using the PCA factors for media use (survey 2 only).
Figure 2. Intention to share true vs. false headlines by use of professional and social media for getting news about the election (only survey 2).
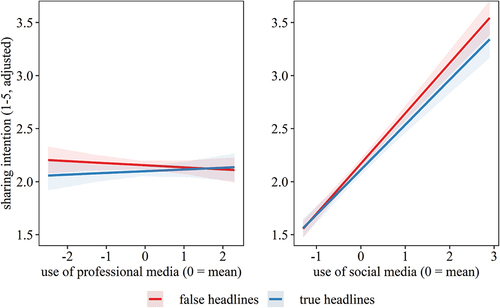
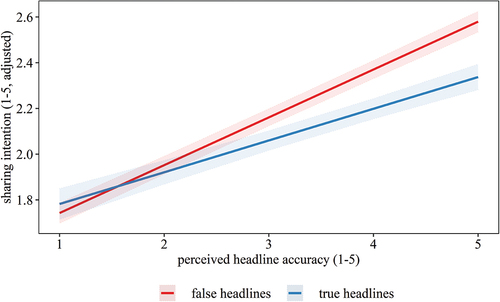
Figure 3. Intention to share true vs. false headlines by perceived headline accuracy (only survey 2).
Supplemental Material
Download MS Word (2.8 MB)Data Availability Statement
The data described in this article are openly available in the Open Science Framework at https://osf.io/xfked/?view_only=f3df4b38d106460e84eaf86352b1a3e3.