
Figures & data
Table 1. Negative binomial regression (2014) (β coef).
Table 2. Negative binomial regression (2019) (β coef).
Figure 1. Odds ratio, logistic regression of party family effect on content character.
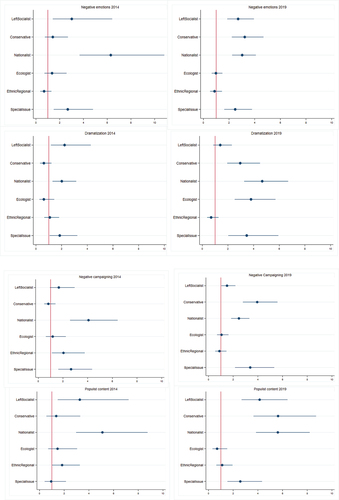
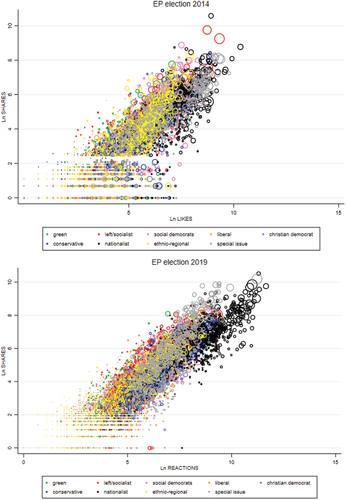
Figure 2. User engagement (likes, shares, comments) by party family in 2014 and 2019.
Each bubble represents a Facebook post, which is located according to its number of likes and shares. The size of the bubble reflects the number of comments – the more comments, the larger the bubble.
Supplemental material