
Figures & data
Table 1. Codebook for article classification.
Figure 1. Prevalence of different categories of media coverage.
Stacked colored bar chart, depicting the number of news articles published in one of the six topic categories (Business, Employee, Features, Legal, Policy, Politics & Regulation, Society) over a 15-year period.
Note: Number of articles per topic category per month.
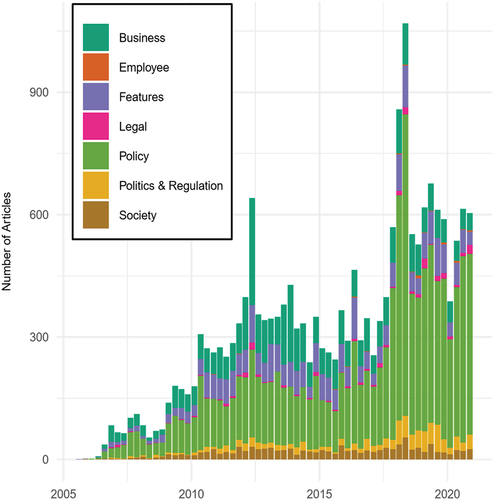
Figure 2. Proportion of negative media coverage received by Facebook, Twitter, and YouTube. Percentage of negative articles published about each platform. Thirty weeks rolling average. The rugs indicate recorded policy changes.
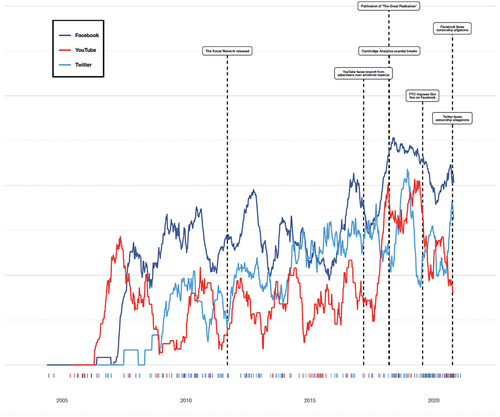
Table 2. Proportion of negative and non-negative coverage.
Table 3. Effect of cumulative negative coverage on future policy change.
Supplemental material