
Figures & data
Figure 1. Study flowchart. This figure provides a systematic overview of the respondents included in this study.
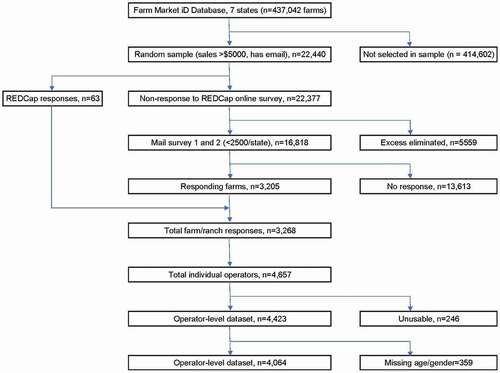
Table 1. Organic (grain/hay/feed) dust exposure by age, operator status and gender.
Table 2. Respiratory conditions among operators by state and organic grain/hay/feed) dust exposure.
Figure 2. Hotspot analysis- Rate of respiratory conditions in central states. This figure was generated using the Getis-ord hotspot analysis method. Each dot represents a farm (up to 3 operators), and the clustering is based on the rate of respiratory conditions per farm to identify the hot spot (vulnerable to respiratory illness). The red dots represent vulnerability to respiratory illness, and the blue dots represent protectiveness to respiratory illness.
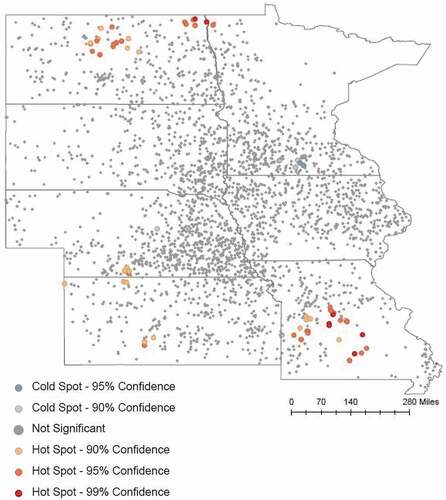
Table 3. Risk factors for respiratory conditionsa (n = 4,064).
Table 4. Association of plant-based organic dust and respiratory conditions (n = 4,064).