
Figures & data
Figure 1. Study flow.
aParticipant declined to take assessment, test was lost, or participant did not have time to complete. bParticipant declined to take assessment, lost-to follow-up, test was lost, or participant did not have time to complete. cParticipants for which knowledge assessment was available at least one time point.
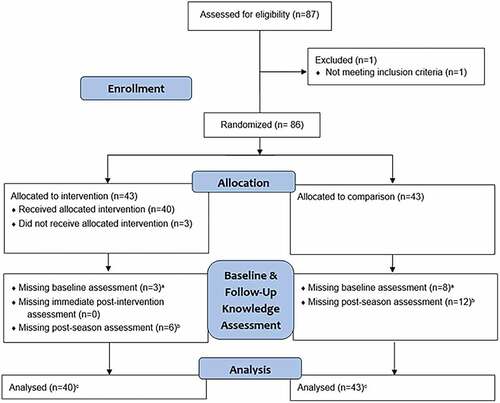
Table 1. Participant characteristics by intervention versus comparison group, n (%).
Figure 2. Knowledge test scores by time point and group.
Table 2. Knowledge test scores by time point and group (N = 83, 43 comparison, 40 intervention).
Figure 3. Knowledge test scores by company size and group.
Table 3. ANOVA results with the main effects and interactions.
Table 4. Comparison of the difference between Test 3 and Test 1 knowledge scores in intervention and comparison groups, overall and stratified by company.
Supplemental material