Figures & data
Figure 1. Indentation load as a function of displacement for different amplitudes (1, 5, 10 nm).
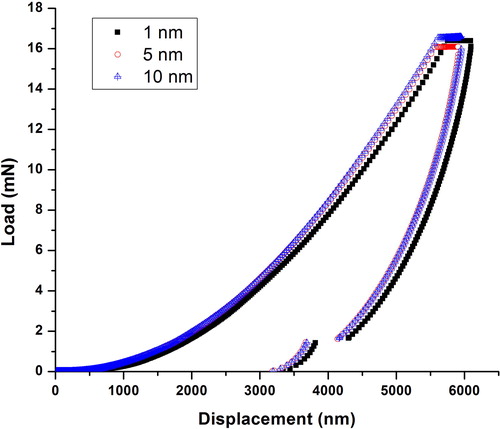
Figure 2. Hardness as a function of displacement for different amplitudes (1, 5, 10 nm).
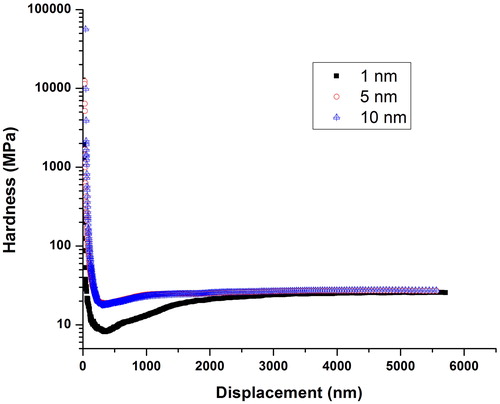
Figure 3. Modulus as a function of displacement for different amplitudes (1, 5, 10 nm).
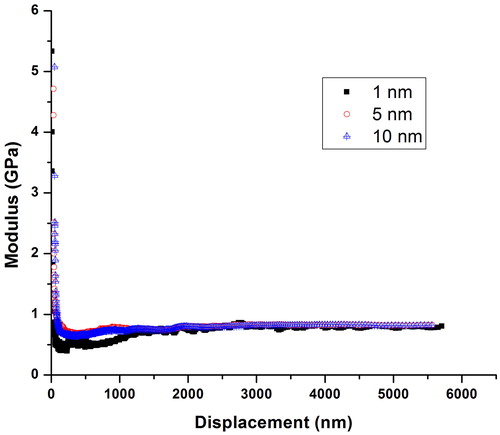
Figure 4. Indentation Load as a function of displacement for different frequencies (11.2, 22.5, 45 Hz).
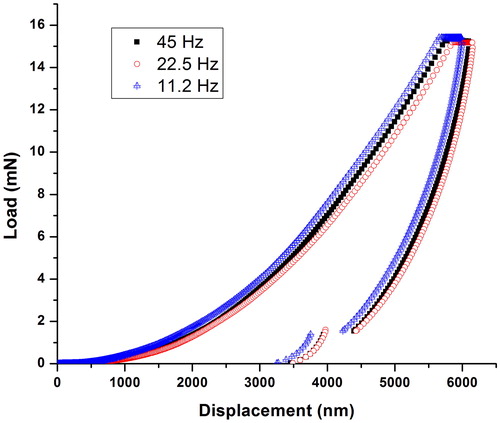
Figure 5. Hardness as a function of displacement for different frequencies (11.2, 22.5, 45 Hz).
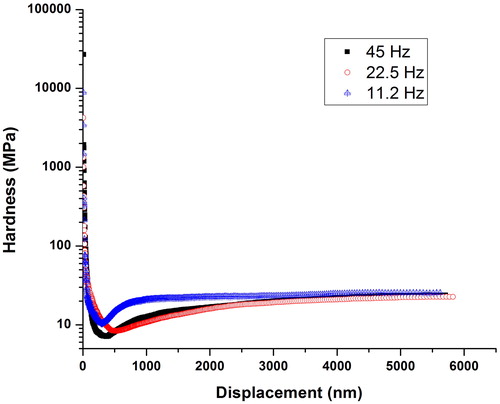
Figure 6. Modulus as a function of displacement for different frequencies (11.2, 22.5, 45 Hz).
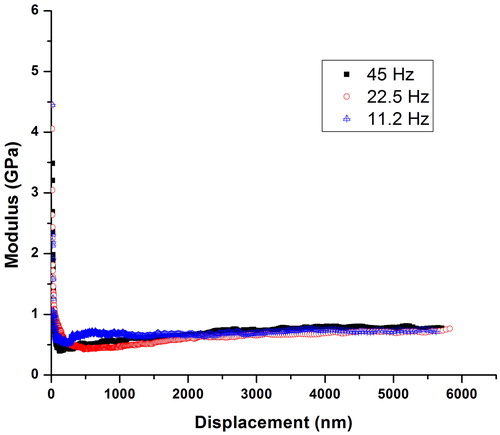
Figure 7. Indentation load as a function of displacement for different strain rates (0.02, 0.05, 0.1, 0.2, 1 s−1).
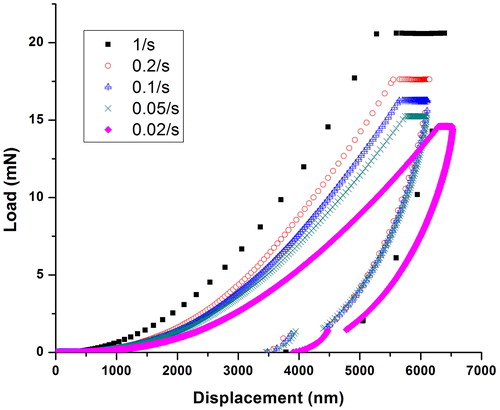
Figure 8. Creep displacement as a function of strain rate at a constant frequency of 45 Hz and an amplitude of 2 nm.
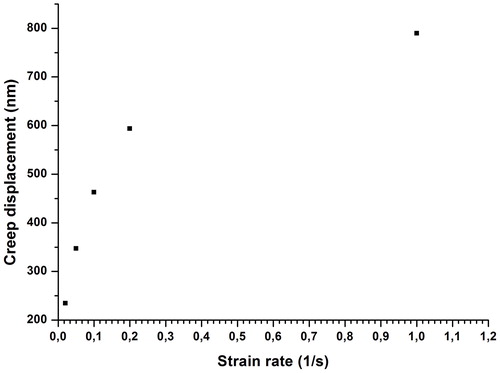
Figure 9. Hardness as a function of displacement for different strain rates (0.02, 0.05, 0.1, 0.2, 1 s−1).
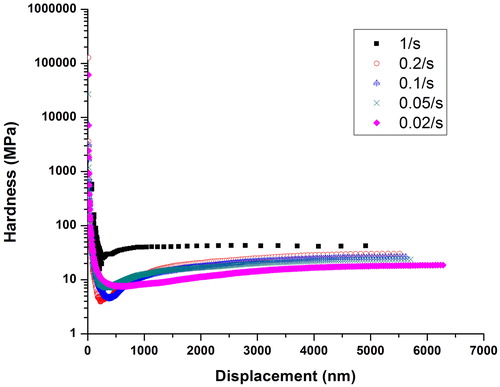
Figure 10. Modulus as a function of displacement for different strain rates (0.02, 0.05, 0.1, 0.2, 1 s−1).
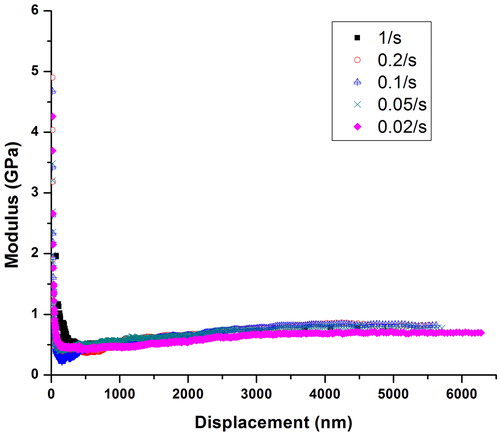
Figure 11. Indentation load as a function of displacement by having peak load of 10 mN for different holding times (1, 3, 5, 10, 20, 50, 100 sec).
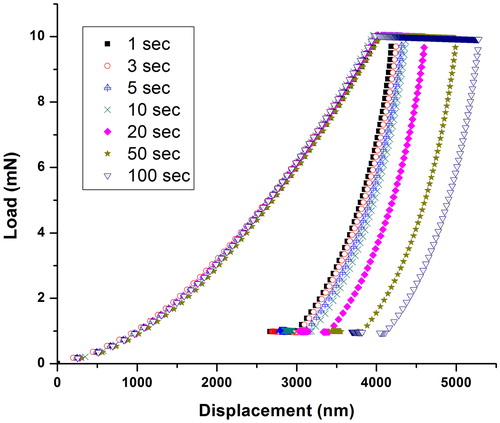
Figure 12. Indentation load as a function of displacement by having peak load of 30 mN for different holding times (1, 3, 5, 10, 20, 50, 100 sec).
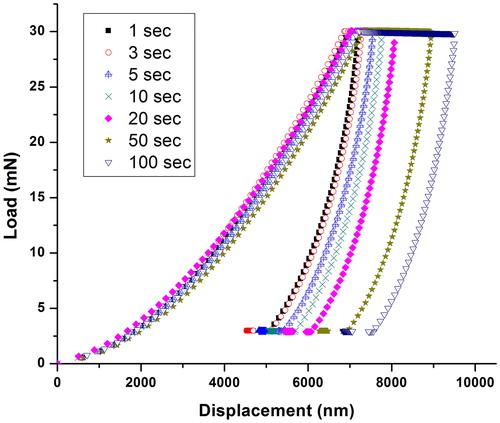
Figure 13. Indentation load as a function of displacement by having peak load of 100 mN for different holding times (1, 3, 5, 10, 20, 50, 100 sec).
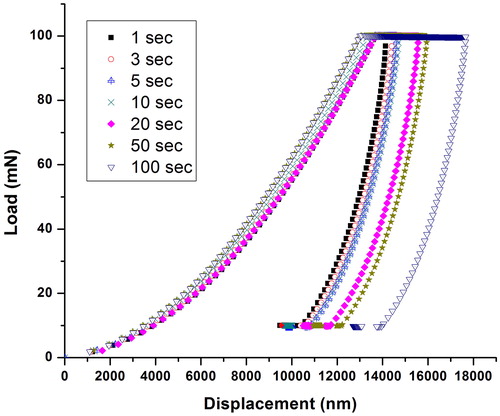
Figure 14. Creep displacement as a function of holding time for different peak loads (10, 30, 100 mN). The solid line represents model fitting.
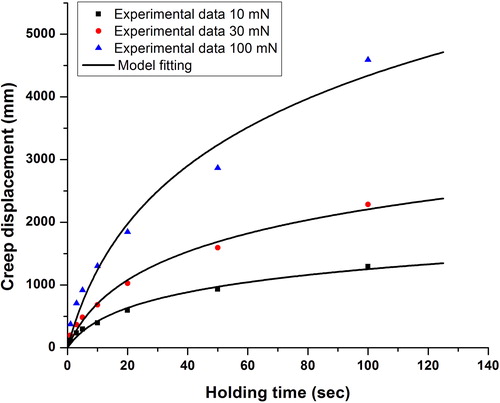
Table 1. Values of fitting parameters for EquationEq. [1][1]
[1] .
Figure 15. Hardness as a function of holding time for different peak loads (10, 30, 100 mN). Bars represent standard deviation.
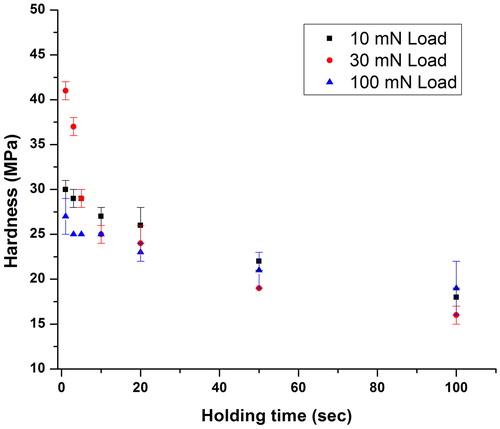
Figure 16. Modulus as a function of holding time for different peak loads (10, 30, 100 mN). Bars represent standard deviation.
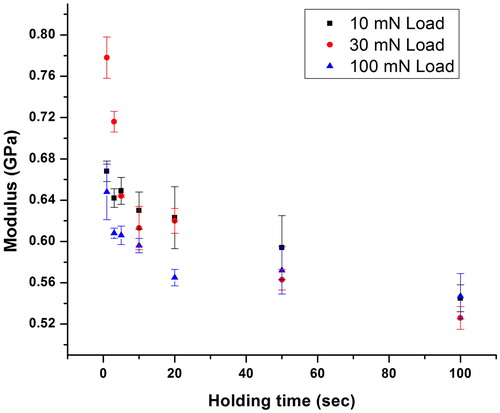
Table 2. Recommended holding times for LDPE with different peak loads.
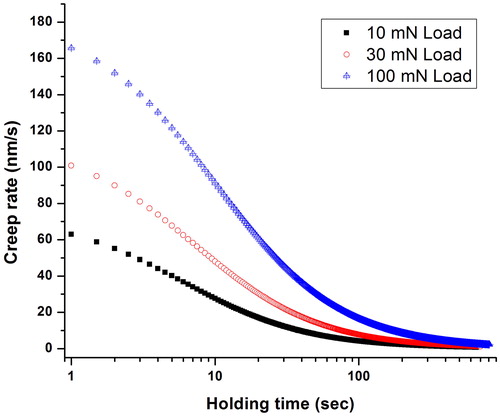
Figure 17. Creep rate as a function of holding time for different peak loads (10, 30, 100 mN).