Figures & data
Table 1. Elements for the question: “We would now like to know what you consider being the essential characteristics of democracy. Use this scale where 1 means ‘not at all an essential characteristic of democracy’ and 10 means ‘an essential characteristic of democracy.’”
Table 2. Elements for questions involving the level of state involvement in market dynamics and social issues
Figure 1. The five indices measuring views on democracy and the market in Belarus.
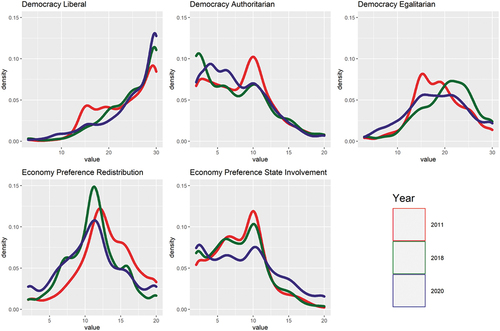
Figure 2. Correlation plot for individual variables across the five indices for the three survey years.
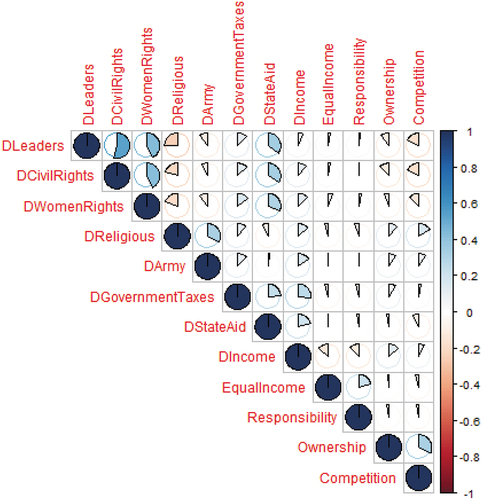
Figure 3. Results of Poisson regression on aggregate index scores.
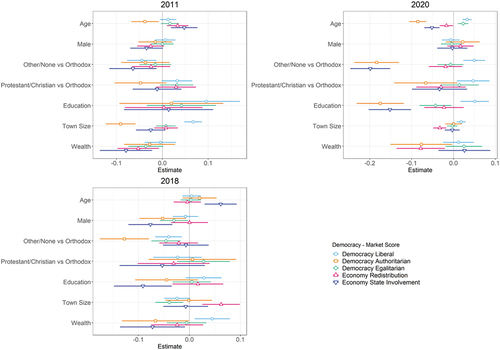
Figure 4. Response variation by age on the five indices measuring views on democracy and the market in Belarus.
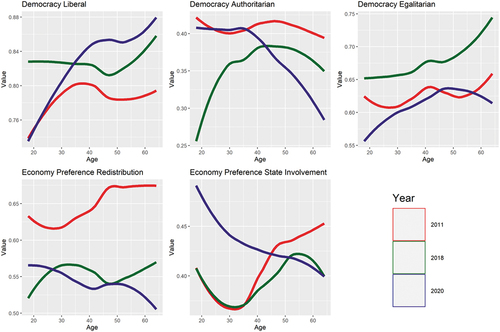
Figure 5. Proportional odds model showing relationship between trust and understandings of democracy, the state, and the market in Belarus.
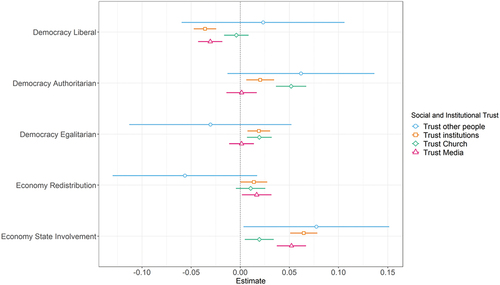
Figure 6. Proportional odds model showing relationship between political attitudes (importance of emocracy) and understandings of democracy, the state, and the market in Belarus.
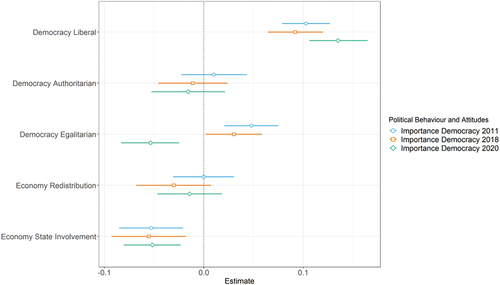
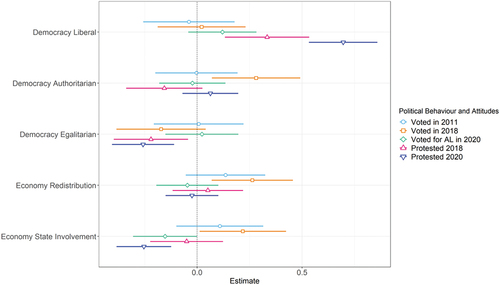
Figure 7. Proportional odds model showing relationship between political attitudes (voting and protest activity) and understandings of democracy, the state, and the market in Belarus.