
Figures & data
Figure 1. Interview locations. Note: The map shows the approximate locations within Armenia where the interviews for the Legacies of Genocide survey were conducted.
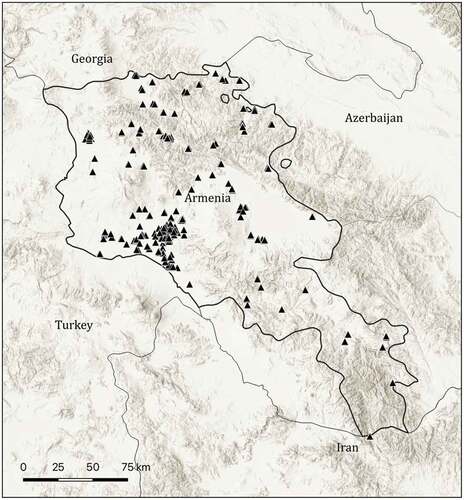
Figure 2. Known pre-genocide origins and destinies of contemporary Armenians. Note: The map in Figure 2a shows reported family origins as reported in the survey. Each location is indicated with a black marker. The map shows origins where village-, town-, or city-level information was available; the bar chart (Figure 2b) includes the full information, including cases where only province or country-level information on origins could be obtained. Percentages are based on 2,512 locations indicated by 2,156 respondents. Where respondents provided more than one location, the most distant origin is used in the calculations. 481 respondents did not indicate a family origin. (a) Map of family origins.
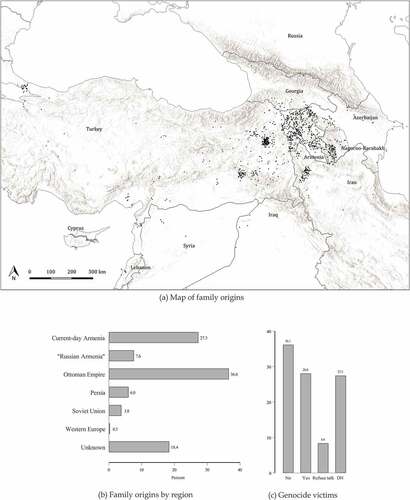
Figure 3. Attitudes towards geopolitical powers and neighboring countries. Notes: Bar charts showing level of warmth felt towards the indicated countries (Figure 3a); coefficient plot from a regression of the feeling thermometer measure on the indicator for having had one or more family members killed in the genocide (Figure 3b). OLS regressions. Markers are point estimates, lines 90/95% confidence intervals. Coefficients that are not statistically significant at the 10% level are shaded in grey. Missing values multiply imputed. The complete regression output can be found in Table A2 in the online appendix, and results using only non-missing values are shown in Figure A3 in the online appendix.
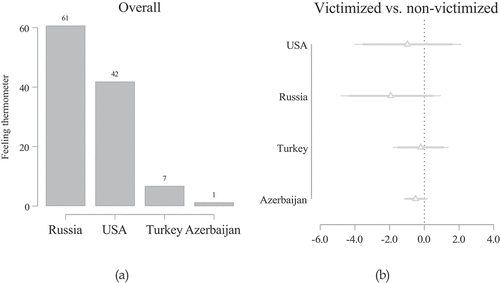
Figure 4. Ethnocentrism, militarism, reconciliation, and genocide recognition. Notes: Bar charts showing the distribution of ethnocentric, militarist, and reconciliatory attitudes in the Armenian resident population, plus attitudes towards the relative priority that pushing for the international recognition of the genocide should take.
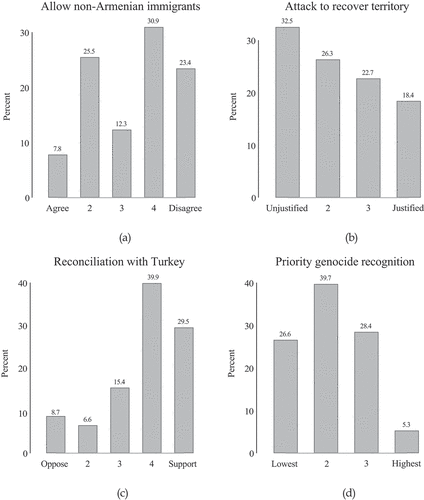
Figure 5. Family victimization and attitudes towards ethnocentrism, militarism, reconciliation, and recognition. Notes: Coefficient plots from a regression of the attitude measures on the indicator for hailing from a family with genocide victims. OLS regressions. Markers are point estimates, lines 90/95% confidence intervals. Coefficients that are not statistically significant at the 10% level are shaded in grey. Missing values multiply imputed. The complete regression output can be found in Table A3 in the online appendix, and results using only non-missing values are shown in Figure A3 in the online appendix.
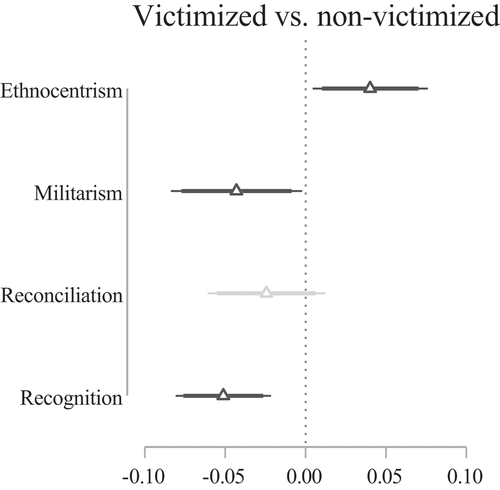
Figure 6. Behavioral measures. Notes: Bar charts showing the overall share of respondents that donated, the share that donated to the Karabakh veterans association, the share that donated to the Hrant Dink foundation, and the share of respondents with sons aged 18 or more whose sons served on the front line with Azerbaijan (Figure 6A). Coefficient plots from regressions of the propensity to donate and likelihood to serve on the indicator for having had one or more family members killed during the genocide (Figure 6B). OLS regressions. Markers are point estimates, lines 90/95% confidence intervals. Coefficients that are not statistically significant at the 10% level are shaded in grey. Missing values multiply imputed. The complete regression output can be found in Table A4 in the online appendix, and results using only non-missing values are shown in Figure A3 in the online appendix.
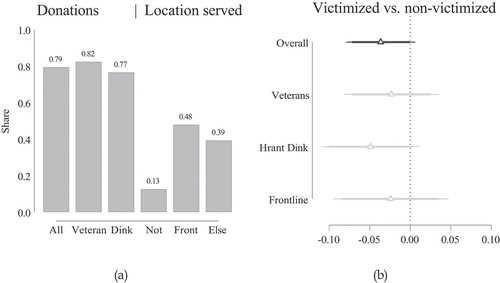
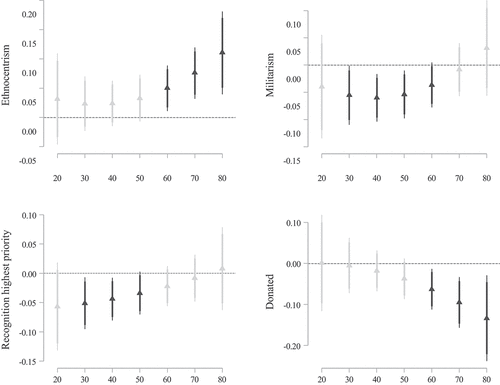
Figure 7. Marginal effect of family victimization depending on age. Note: Effect of having had one or more family members killed in the genocide on selected outcomes (on the y-axis), by age of the respondent (on the x-axis). Marginal effect after OLS regression using non-missing values. Markers are point estimates, lines 90/95% confidence intervals. Coefficients that are not statistically significant at the 10% level are shaded in grey. Standard errors adjusted for survey design.
Supplemental Material
Download MS Word (338 KB)Data availability statement
The data and code used in this study are available on Harvard's Dataverse at https://doi.org/10.7910/DVN/IS0ADG.