1,520
Views
6
CrossRef citations to date
0
Altmetric
Articles

Anion transport and binding properties of N N′-(phenylmethylene)dibenzamide based receptors

, , , &
Pages 10-17 | Received 12 Mar 2015, Accepted 22 Mar 2015, Published online: 27 Apr 2015

Figures & data

Figure 1 Bisamide based receptors 17.
Figure 1 Bisamide based receptors 1–7.

Table 1 Apparent stability constants (M− 1) in A) DMSO-d6/0.5 % water and B) 59.75 % acetonitrile-d3/39.75 % DMSO-d6/ 0.5 % water.
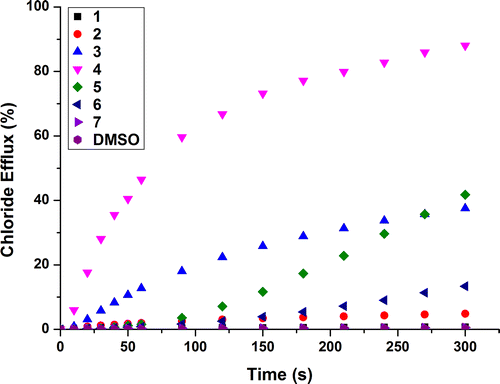
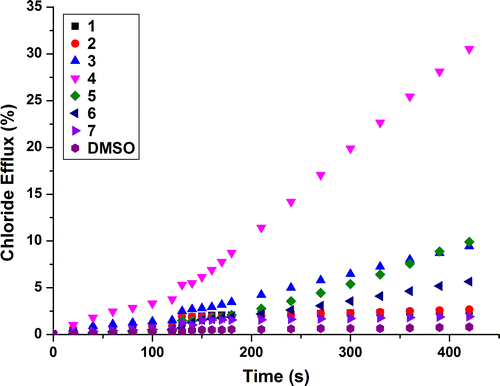
Figure 2 (Colour online) Chloride efflux facilitated by 17 at 2 mol% loading (with respect to lipid) from POPC vesicles containing 489 mM NaCl buffered to pH 7.2 with 5 mM sodium phosphate salts suspended in 489 mM NaNO3 buffered to pH 7.2 with sodium phosphate salts. To end the experiment detergent was added to lyse the vesicles and this final chloride efflux was used as 100 % to calibrate the ion selective electrode. Each point is an average of three runs.
Figure 2 (Colour online) Chloride efflux facilitated by 1–7 at 2 mol% loading (with respect to lipid) from POPC vesicles containing 489 mM NaCl buffered to pH 7.2 with 5 mM sodium phosphate salts suspended in 489 mM NaNO3 buffered to pH 7.2 with sodium phosphate salts. To end the experiment detergent was added to lyse the vesicles and this final chloride efflux was used as 100 % to calibrate the ion selective electrode. Each point is an average of three runs.
Figure 3 (Colour online) Chloride efflux facilitated by 17 at 2 mol% loading (with respect to lipid) from POPC vesicles containing 450 mM NaCl buffered to pH 7.2 with 20 mM sodium phosphate salts suspended in 162 mM Na2SO4 buffered to pH 7.2 with sodium phosphate salts. At 120 s a NaHCO3 solution was added to give a 40-mM external concentration. To end the experiment detergent was added to lyse the vesicles and this final chloride efflux was used as 100% to calibrate the ion selective electrode. Each point is an average of three runs.
Figure 3 (Colour online) Chloride efflux facilitated by 1–7 at 2 mol% loading (with respect to lipid) from POPC vesicles containing 450 mM NaCl buffered to pH 7.2 with 20 mM sodium phosphate salts suspended in 162 mM Na2SO4 buffered to pH 7.2 with sodium phosphate salts. At 120 s a NaHCO3 solution was added to give a 40-mM external concentration. To end the experiment detergent was added to lyse the vesicles and this final chloride efflux was used as 100% to calibrate the ion selective electrode. Each point is an average of three runs.

Table 2 EC50 and Hill coefficient (n) values for receptors 26.

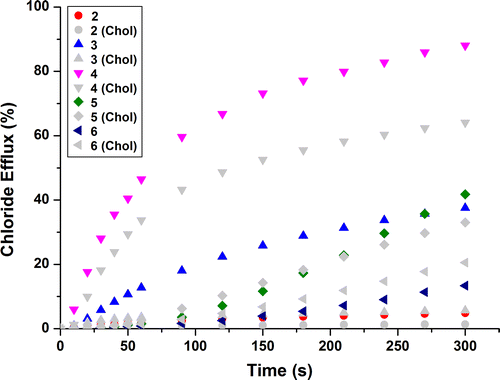
Figure 4 (Colour online) Chloride efflux facilitated by 26 at 2 mol% loading (with respect to lipid) from POPC: Cholesterol (7:3) vesicles containing 489 mM NaCl buffered to pH 7.2 with 5 mM sodium phosphate salts suspended in 489 mM NaNO3 buffered to pH 7.2 with sodium phosphate salts. To end the experiment detergent was added to lyse the vesicles and this final chloride efflux was used as 100% to calibrate the ion selective electrode. Each point is an average of three runs. DMSO was used for the blank run.
Figure 4 (Colour online) Chloride efflux facilitated by 2–6 at 2 mol% loading (with respect to lipid) from POPC: Cholesterol (7:3) vesicles containing 489 mM NaCl buffered to pH 7.2 with 5 mM sodium phosphate salts suspended in 489 mM NaNO3 buffered to pH 7.2 with sodium phosphate salts. To end the experiment detergent was added to lyse the vesicles and this final chloride efflux was used as 100% to calibrate the ion selective electrode. Each point is an average of three runs. DMSO was used for the blank run.
Figure 5 (Colour online) NMR dilution studies: stack plots of spectra differing in concentration (1–100 mM) samples in DMSO- d6. (a) Small upfield shift of proton Ha. (b) Small downfield shift of proton Hb.
Figure 6 (Colour online) (a) Uncomplexed receptors 2 and 6. (b) Self aggregation through hydrogen bonding to adjacent receptor molecules (distances in Å).
Supplemental material

Supplemental Material

Download MS Word (8.1 MB)