Figures & data
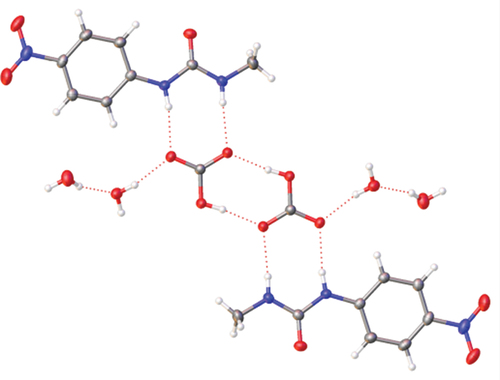
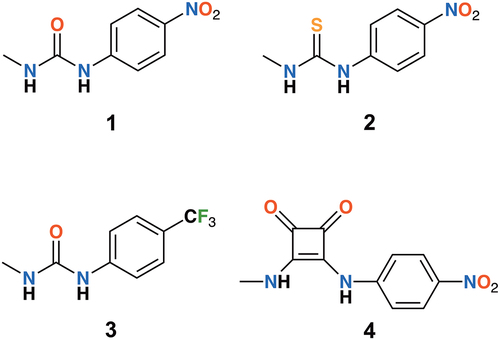
Figure 1. Minimal anion-binding receptors 1-4.
Scheme 1. G-series chemical warfare agents and their hydrolysis products.
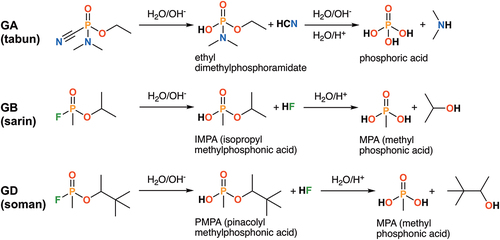
Table 1. Experimental parameters used for fluorescence scans of compounds 1-3.
Scheme 2. Synthesis of minimal receptors: 1 (X = O, R = NO2), 2 (X = S, R = NO2), 3 (X = O, R = CF3) and 4.
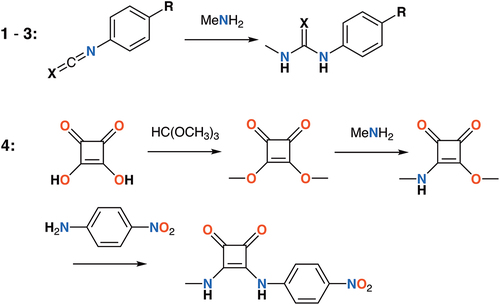
Figure 2. Colour changes of receptors (from top) 1, 2, 3 (in acetonitrile) and 4 (in DMSO) with one equivalent of TBA anions (5 mM in acetonitrile): (l to r) free receptor, F−, Cl−, Br−, I−, NO3−, CH3CO2−, H2PO4−, OH−, HSO4−, BF4−.
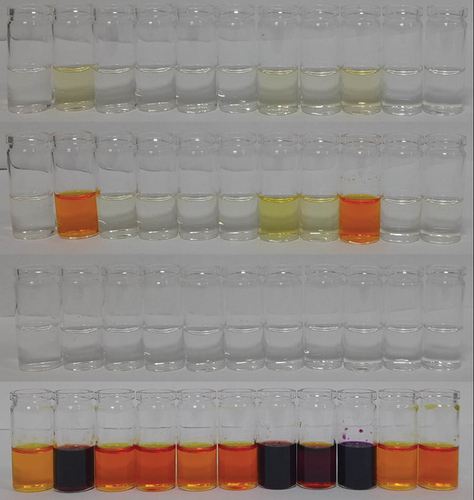
Table 2. Bathochromic shifts of the main absorption bands of 1 to 3 from the initial λmax shown on addition of excess anion. *Not determined due to overlap of anion and receptor absorbance.
Figure 3. Examples of UV-visible titration responses of 2: F− (top) and NO3− (bottom).
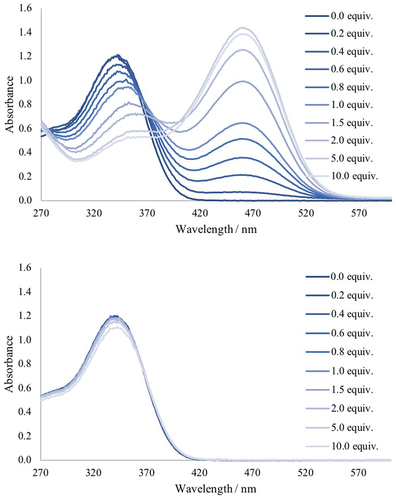
Table 3. Anion-binding constants calculated from UV-vis titrations for receptors 1-3 in acetonitrile for their respective TBA salts. *Not determined.
Figure 4. Fluorescent response of receptor 2 to additions of TBAF (top) and TBAOH (middle) in acetonitrile with a comparison over 5 equivalents of anions (bottom).
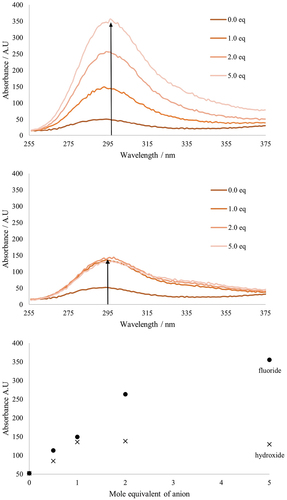
Table 4. Gibbs’ free energies calculated by PM6.
Table 5. Experimental and computed structural data for receptors 1-3.
Figure 5. Structures of a) 1·CH3CO2−, b) (1·HCO3−)2, c) 1·F− and d) 1·OH− from DFT calculations.
Figure 6. Crystal structure of 1 showing the solid-state molecular structure (left) and hydrogen bonding within the crystal structure (right).
Table 6. Single crystal X-ray crystallographic details and parameters for 1, 1·TBA·CH3CO2, 1·TBACO3H, 2 and 3.
Figure 7. Solid-state molecular structure from single crystal X-ray diffraction of 1·TBA·CH3CO2·H2O showing hydrogen bonding (left) and crystal packing (right) with TBA counterions removed for clarity.
Figure 8. Crystal structure of 1·TBA·HCO3·2 H2O showing hydrogen bonding (left) and the (HCO3−)2 dimer (right) with TBA counterions removed for clarity.
Figure 9. Crystal structure of 2 showing the solid-state molecular structure (left) and intermolecular hydrogen bonding within the crystal structure (right).
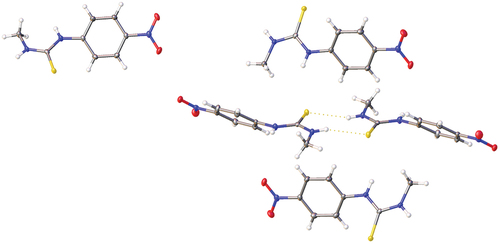
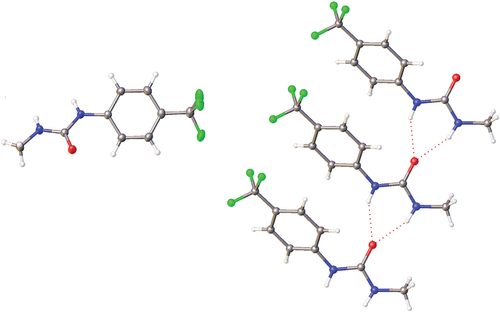
Figure 10. Crystal structure of 3 showing the solid-state molecular structure (left) and hydrogen bonding within the crystal structure (right).