
Figures & data
Figure 1. (A) RNAseq analysis of LAN5, SK-N-SH (SH), KELLY and IMR32 cells shows the relative amounts of mRNA present for genes CYP26A1, CYP26B1 and CYP26C1. mRNA levels after ATRA treatment for 24 h are also shown for LAN5 and SH cells. (B) Chemical structures of compounds C2 and C17, with their respective IC50 values against CYP26A1 [Citation19]. (C) Quantitative PCR was carried out on SK-N-SH cells after treatments with ATRA, RAMBA C2 and C17 and in combinations. Treatments were for 72 h. The relative abundance of CYP26A1 mRNA is shown, normalised to untreated cells at 1.0. Error bars are standard deviations of triplicate, technical replicates (n = 1).
![Figure 1. (A) RNAseq analysis of LAN5, SK-N-SH (SH), KELLY and IMR32 cells shows the relative amounts of mRNA present for genes CYP26A1, CYP26B1 and CYP26C1. mRNA levels after ATRA treatment for 24 h are also shown for LAN5 and SH cells. (B) Chemical structures of compounds C2 and C17, with their respective IC50 values against CYP26A1 [Citation19]. (C) Quantitative PCR was carried out on SK-N-SH cells after treatments with ATRA, RAMBA C2 and C17 and in combinations. Treatments were for 72 h. The relative abundance of CYP26A1 mRNA is shown, normalised to untreated cells at 1.0. Error bars are standard deviations of triplicate, technical replicates (n = 1).](/cms/asset/dcb47363-5401-4b07-b807-8c276ef8708a/idrt_a_1710157_f0001_b.jpg)
Figure 2. (A) SK-N-SH cells were treated with ATRA alone, or in combination with RAMBA C2 or C17, for 72 h. RAMBAs by themselves had no effect on cell morphology. In combination with ATRA, RAMBAs induce a highly rounded, refractile morphology (insets). Scale bar = 50 µm (25 µm for insets). (B) SK-N-SH cells were treated with 0.1 µM ATRA and RAMBAs C2 and C17 for 72 h and neurite lengths were measured (n = 3). Standard deviations are shown. ANOVA comparisons show where mean neurite lengths are significantly longer compared with ATRA alone (Bonferroni’s and Dunnett’s post hoc corrections *p<.05; **p<.01). (C) SK-N-SH cells were treated for 72 h with ATRA, RAMBA C2 and combinations. Immunoblotting shows relative levels of pAKT and AKT present in cell lysates. (D) Protein bands were quantified and mean pAKT intensities were normalised against AKT and compared using ANOVA (n = 3). Controls are untreated cells. SD are shown, **p<.01 compared to ATRA alone.
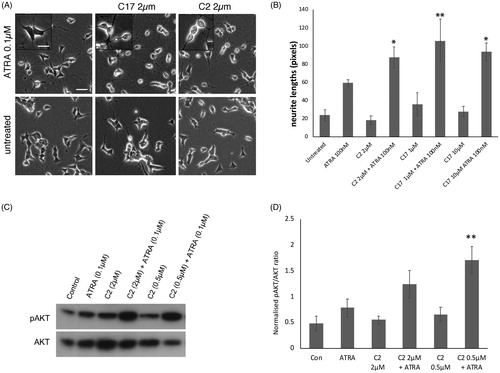
Table 1. Liposome parameters.
Figure 3. (A) SK-N-SH cells were treated for 72 h with 0.1 µM ATRA, C17-containing liposomes, or combinations of the two. Controls (con) are untreated and maximal concentrations of RAMBAs are indicated. Neurites were measured and statistical comparison made against the mean of ATRA single treatment. SD are shown, *p<.05, **p<.01; n = 3. (B) SK-N-SH cells were treated for 72 h with 0.1 µM ATRA, C2-containing liposomes, empty liposomes and combinations (n = 3). SD are shown, *p<.05, **p<.01 using ANOVA.
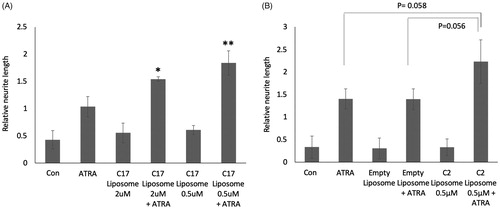
Figure 4. (A) SK-N-SH cells were treated for 72 h with 0.1 µM ATRA, 2 µM C2 liposomes (C2), 0.5 µM C17 liposomes (C17) and combinations thereof. Phase contrast images show that liposomal RAMBAs in combination with ATRA generated highly rounded, neuron-like cells (arrows); 2× enlargements are shown below the main panels. (B) SK-N-SH cells treated for 72 h with empty liposomes (EL) with or without 0.05 µM ATRA, and 0.5 µM C17 liposomes plus 0.05 µM ATRA. Scale bar = 50 µm for rows 2, 4 and 5; 100 µM for rows 1 and 3. Maximal, hypothetical concentrations of the RAMBAs are indicated.
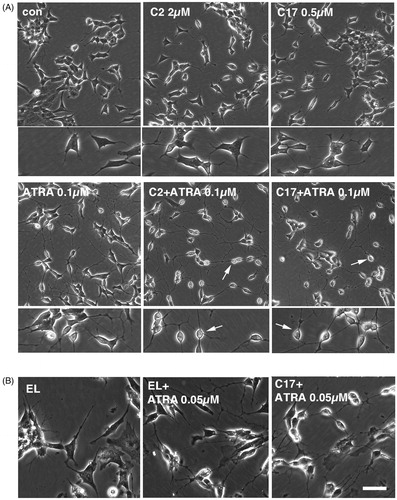
Figure 5. (A) SK-N-SH cells were treated for 72 h with ATRA, C17 liposomes (C17 lipo), or combinations. Immunoblotting shows levels of pAKT and AKT; the untreated lane is from the same blot. (B) A second experiment is shown in which SK-N-SH was treated with ATRA alone, or in combinations with empty liposomes or C2 liposomes (C2 lipo). Immunoblotting of pAKT and AKT is shown. (C) LAN5 cells were treated for 24 h with 0.1 µM ATRA alone and in combinations with empty liposomes and C2-containing liposomes. Immunoblotting shows levels of N-myc and actin. Two independent experiments are shown and maximal, hypothetical concentrations of the RAMBAs are indicated.
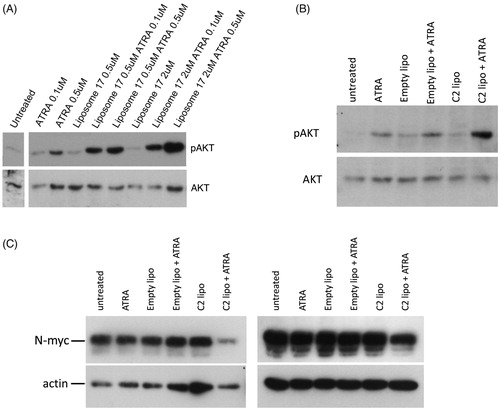
Figure 6. SK-N-SH cells were treated with empty liposomes or C2 liposomes for 24 h. The media was then replaced, with and without 0.05 µM ATRA, and the cells were cultured for six more days. Neurite lengths were measured and means ± SD are shown (n = 3). ANOVA shows significant difference *p<.05.
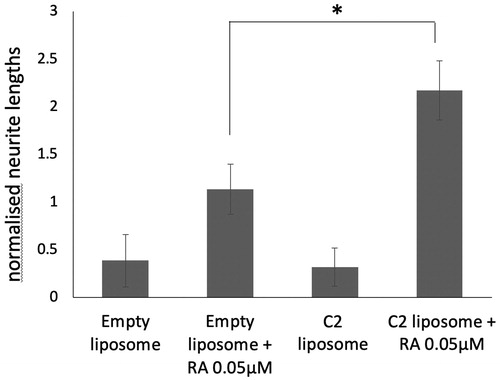
Figure 7. (A, B) KELLY and LAN5 cells were plated in 96-well plates and grown in the presence of a range of concentrations of ATRA or 13-cis-RA. The relative cell survival was measured after six days and plotted with means and SD (n = 3); zero ATRA is treated as 100% survival. (C, D) Cell proliferation rates were assessed in KELLY and LAN5 cells after treatment for six days with zero, 80 nM or 160 nM ATRA, plus either empty liposomes or C2-containing liposomes at 0.5 µM C2 (maximal concentration) (n = 3). ANOVA analysis was performed, and SDs are shown. *p<.05; ns: not significant (p>.05).
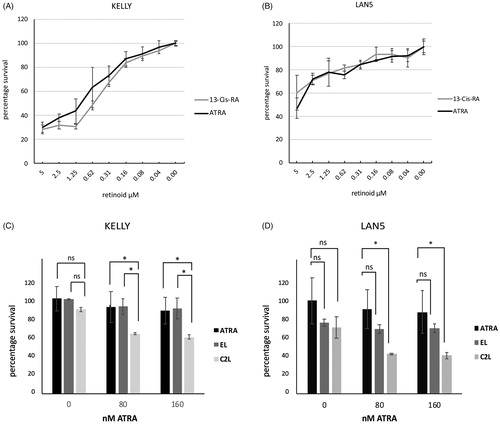
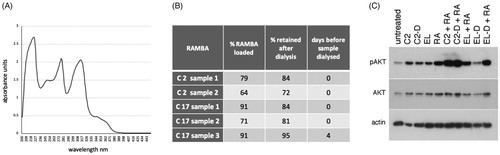
Figure 8. Assessment of the loading and retention of RAMBAs in liposomes. (A) A UV spectrophotometric scan of 100 µM C17 dissolved in ethanol. (B) Table showing independent preparations of liposomes tested for the amount of RAMBA present, expressed as a percentage of the theoretical maximum of 240 µM. The percentage of this RAMBA that remained after a 24 h dialysis against distilled water is given, as well as the time delay between liposome synthesis and the dialysis. (C) Immunoblot of pAKT, AKT and actin from KELLY cells that were treated for 24 h with C2-containing liposomes before (C2) or after (C2-D) dialysis, empty liposomes before (EL) or after (EL-D) dialysis, with or without co-treatment with 0.1 µM ATRA (RA).