Figures & data
Table 1. Participant characteristics (N = 412).
Table 2. Zero-order correlations between T1 PTG and symptoms of anxiety, depression, prolonged grief and PTSD.
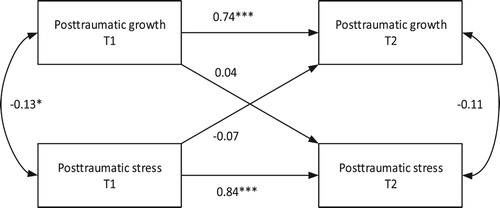
Figure 1. Unstandardized estimated curvilinear relation between PTSD and PTG at T1.
Note: PTG = posttraumatic growth. PTSD = posttraumatic stress disorder. ŷ = 22.941 + 0.461 * x – 0.016 * x².
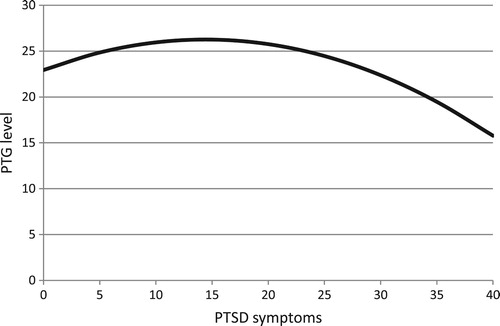
Table 3. Hierarchical regression analyses testing for curvilinear effects of T1 anxiety, depression, prolonged grief and PTSD symptoms on PTG.
Figure 2. Cross-lagged model with standardized coefficients for posttraumatic growth and PTSD.
Note: T1 = time point 1; T2 = time point 2; * p < .05. *** p < .001.