
Figures & data
Figure 1. Illustration of experimental trial structure in the instructed ER flexibility paradigm. ms = milliseconds.
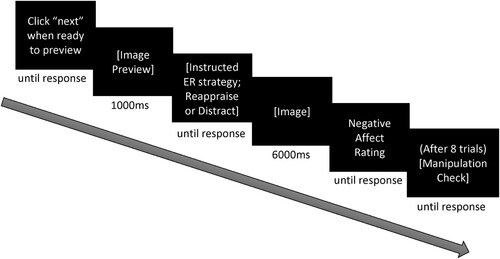
Table 1. Sociodemographic characteristics.
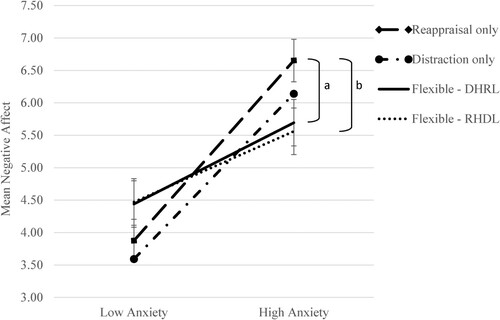
Figure 2. Differences in negative affect ratings between instructed ER conditions for participants in the low and high anxiety groups.
Note: Error bars represent ± 1 standard error (SE). For ease of interpretation, only the error bars for the flexible and the Reappraisal only condition are presented. a: p = .049, b: p = .025.
Data availability statement
The dataset generated and analyzed in the present study is available from the corresponding author on reasonable request.