Figures & data
Figure 1. AGR fuel element.
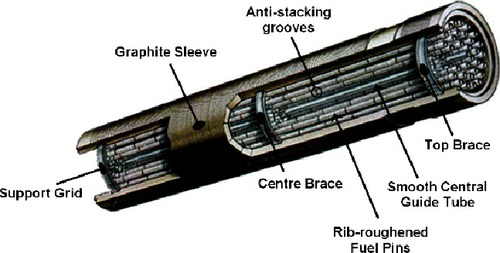
Figure 2. Close-up of the ribbed pins.
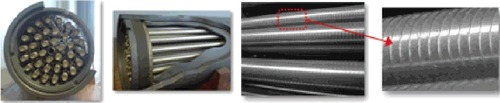
Figure 3. Fuel pin mesh. Left: repeatable base section. Right: ribs on the pins and their absence for the guide tube.
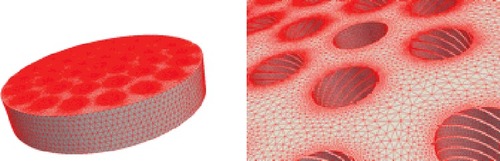
Figure 4. Example of Code_Saturne scalability on a Blue Gene/Q. Serial METIS and PT-Scotch are used as partitioners.
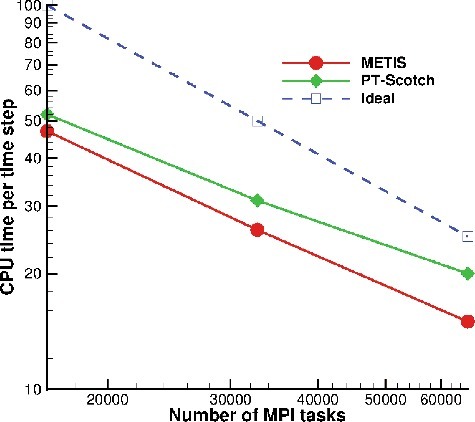
Table 1. Blue Gene/Q simulation using 512 nodes and 32 ranks per node (16,384 cores). The mesh is made of 1,068,926,189 cells.
Figure 5. Streamlines. Left: at the top of Element 2. Right: from the injection boundary.
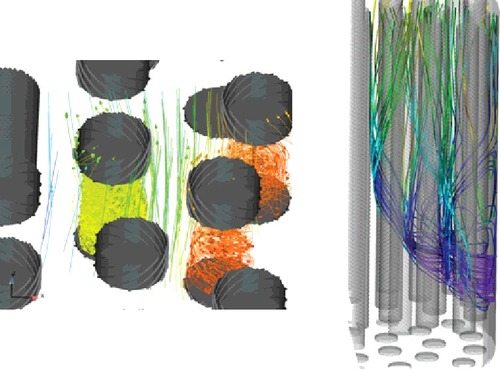
Figure 6. Normalised temperature at each gap (Top: Gap 1). Left: case without injection. Right: case with injection.
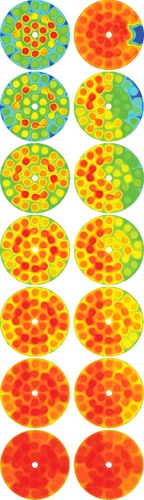
Figure 7. Bulk temperature at each gap.
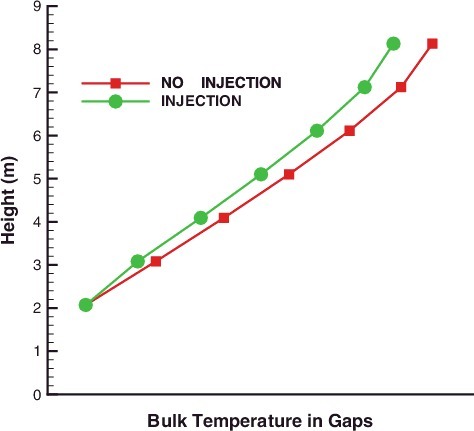
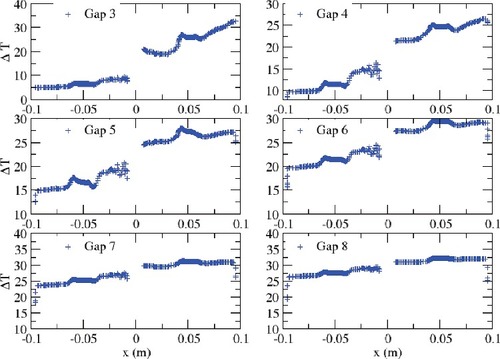
Figure 8. Temperature difference between both cases.