Figures & data
Table 1 Coefficients of the rational approximation for (exponential covariance on
) for m = 1, 2, 3, normalized so that cm = 1.
Fig. 1 The L2- and -errors of the covariance functions for different values of ν for the different approximation methods. When ν = 1, all methods are exact.
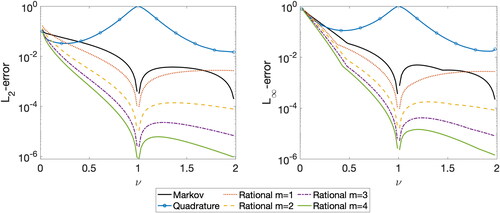
Table 2 Covariance errors () and computing times in seconds (
) for sampling from the rational SPDE approximation u (with
) and, in parentheses, for evaluating
.
Table 3 Results of the parameter estimation.
Fig. 2 Average summer precipitation residuals (in cm) for 1979 and the FEM mesh.
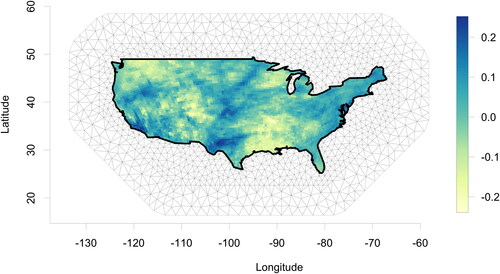
Fig. 3 Nine basis functions modeling the parameters for the nonstationary models.
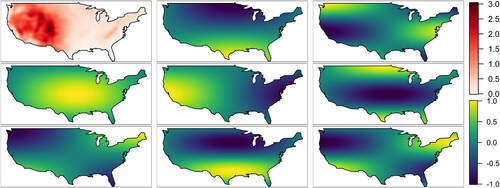
Table 4 Model-dependent results for (i) the log-likelihood, (ii) the pseudo cross-validation scores (RMSE, CRPS, LS, each ) averaged over ten replicates, and (iii) the computational time for one evaluation of the likelihood averaged over 100 computations.
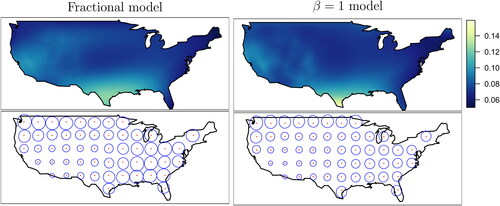
Fig. 4 Estimated marginal standard deviations (top row) and contours of 0.7 correlation of the correlation function for selected locations (bottom row), for the fractional (left column) and β = 1 (right column) models.