Figures & data
Fig. 1 (a) Well-log data with 19 changepoints (vertical dashed blue lines) and segment means (horizontal solid red lines). (b) Segmentation when deleting observation 685. (c) Segmentation when contaminating observation 326. The gray background in panels (b) and (c) highlights the span of changes to the segmentation compared to panel (a).
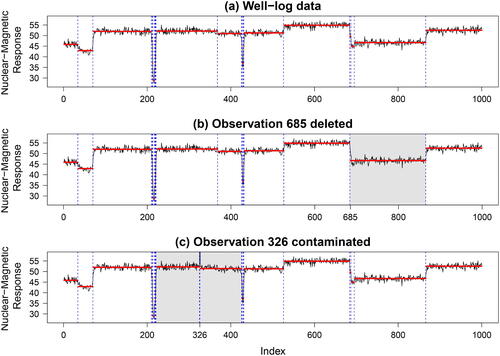
Fig. 2 Workflow for assessing a segmentation’s stability and identifying influence of single data points on the segmentation obtained.
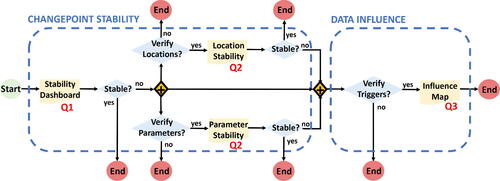
Fig. 3 Simulated data example with four changepoints (vertical dashed lines). The horizontal solid lines are the segment means.
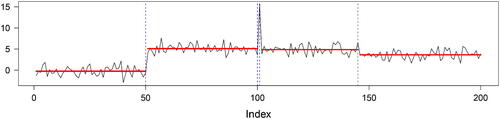
Fig. 4 Stability Dashboard when (a) deleting and (b) contaminating observations.
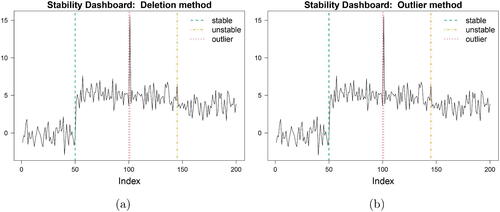
Fig. 5 Location stability plot of the simulated data when (a) deleting and (b) contaminating observations.
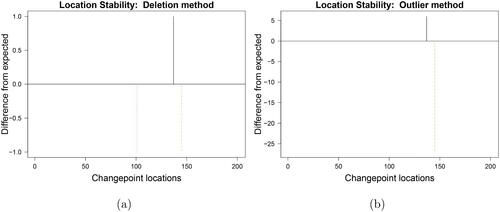
Fig. 6 Parameter stability plot of the simulated data when (a) deleting and (b) contaminating observations.
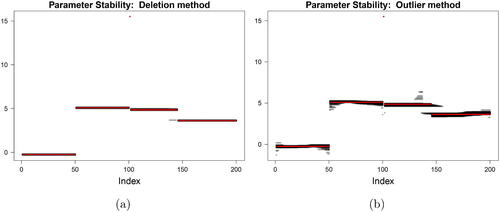
Fig. 7 Main features of the Influence Map.
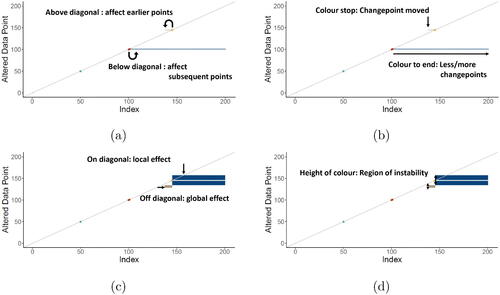
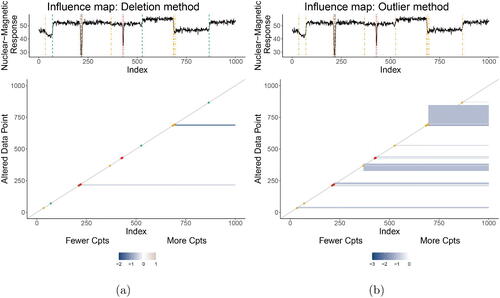
Fig. 8 Influence Map of the simulated data when (a) deleting and (b) contaminating observations.
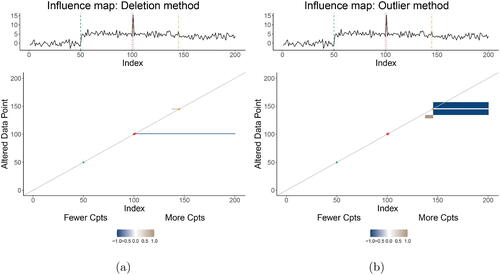
Fig. 9 Stability Dashboards for the Well-log data.
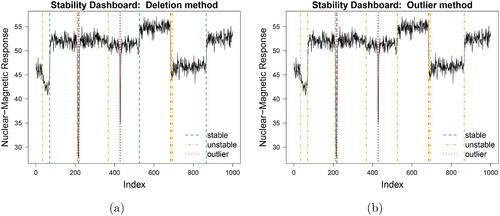
Fig. 10 Location Stability plots for the Well-log data.
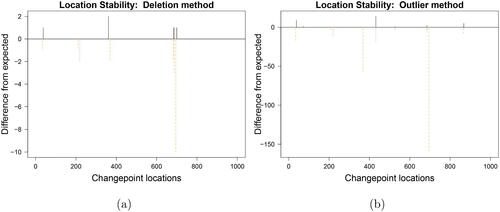
Fig. 11 Parameter Stability plots for the Well-log data.
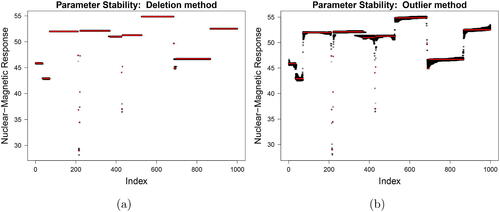
Fig. 12 Influence Maps for the Well-log data.