Figures & data
Fig. 1 Test functions of Donoho and Johnstone (Citation1994).
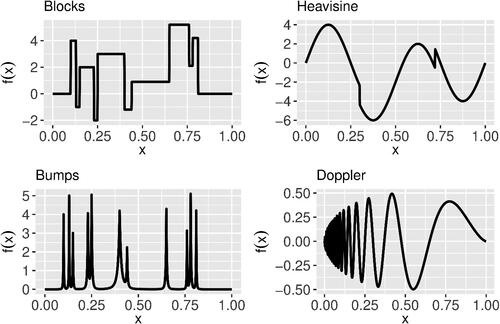
Table 1 Average number of true features (#feat) selected among the 15 most relevant according to each screening method, and average runtime in seconds (time).
Fig. 2 Time series of the meteorological variables recorded at Pinheiros air quality station in São Paulo. The abbreviations wd and gwd refer to wind direction and global wind direction, respectively.
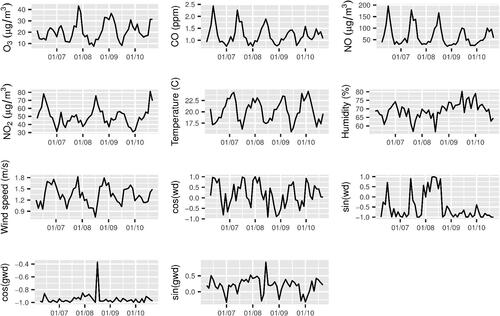
Table 2 The five most relevant variables according to different feature screening methods.
Fig. 3 Plots of the response variable Y (differenced and centered ozone concentrations) and each covariate (differenced and normalized to the unit interval). The curves are warped wavelet regression estimates. The observations are considerably noisy, and only a few features display a noticeable effect on Y, like humidity and wind speed.
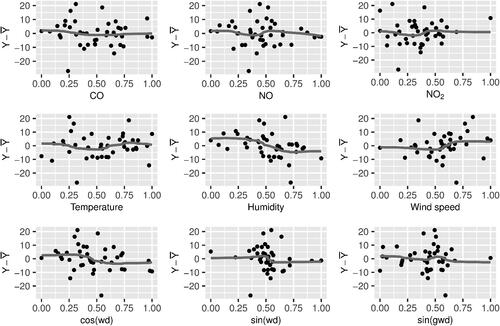
Fig. 4 Boxplot of the observed ages for each group in the epilepsy study.
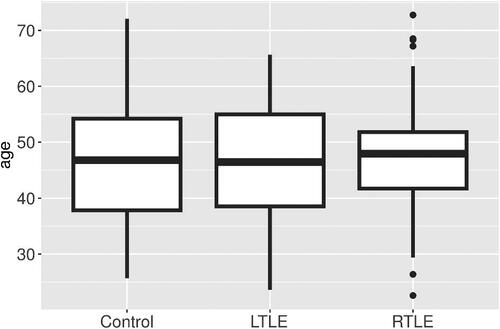
Table 3 The five most relevant variables according to different feature screening methods for each group of participants in the epilepsy study.
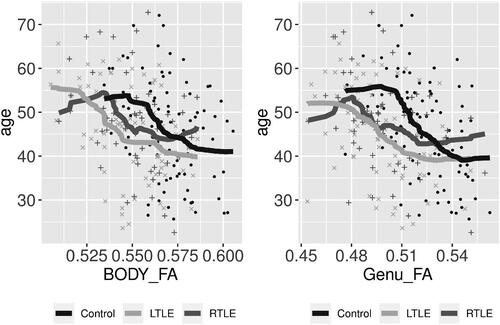
Fig. 5 Scatterplot of observed ages versus the covariates BODY_FA (right) and Genu_FA (left). The symbols , ×, and + correspond to control, LTLE, and RTLE groups, respectively. The solid curves were estimated via warped wavelet regression for each group of patients.