Figures & data
Fig. 1 On the upper panel, GP mean predictor (dashed blue line) of the test function (black line) defined by (A.4) based on 10 evaluations at a regular grid, LOO cross-validation predictions (red stars). Lower panel: absolute prediction errors associated with GP (black line) and LOO (red stars) predictions, and GP prediction standard deviation (dashed blue line).
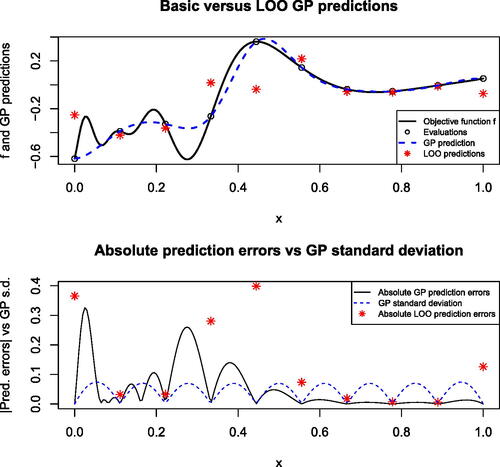
Fig. 2 Correlations between LOO residuals at design points in the example displayed on . This figure was realized with the R package corrplot Wei and Simko (Citation2021).
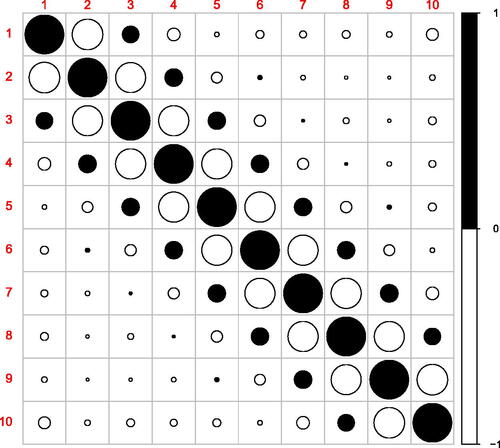
Fig. 3 On the effect of accounting and correcting for correlation in Q-Q plots based on LOO residuals. Left panel: Q-Q plot against of LOO residuals merely divided by corresponding LOO standard deviations. Right panel: Q-Q plot against
of duly transformed LOO residuals.
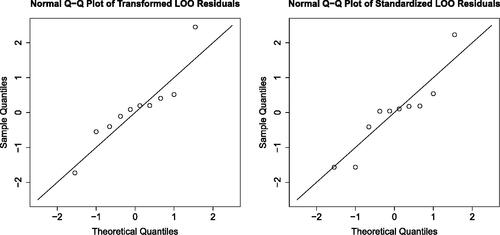
Fig. 4 Relative errors on CV means and covariances (between naive and fast methods, with the naive method as reference) measured in similar settings as on .
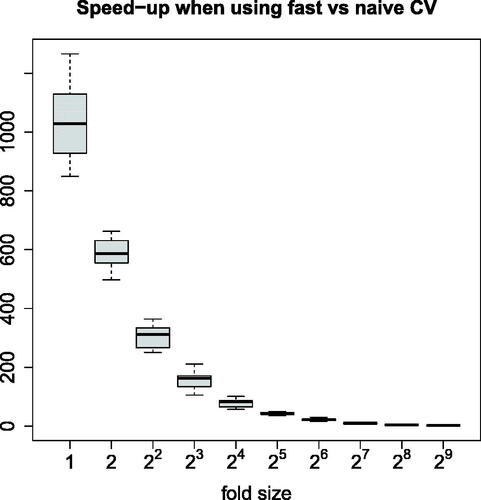
Fig. 5 Speed-up (ratio between times required to run the naive and fast methods) measured for q-fold CV, where q decreases from 1024 to 2 and 50 seeds are used that affect here both model fitting and the folds.
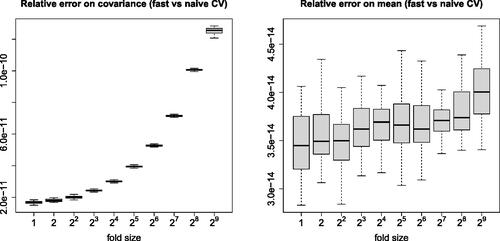
Fig. 6 Contaminant localization test function designed by summing dissimilarities between given concentrations at monitoring wells and corresponding simulation results when varying the candidate source localization (See Pirot et al. (Citation2019) for more detail). The filled disks stand for the experimental design, consisting of 25 clover-shaped clusters of size 5. The small green circle stands for the actual (prescribed) contaminant source, and the red square indicates the grid point with the smallest misfit.
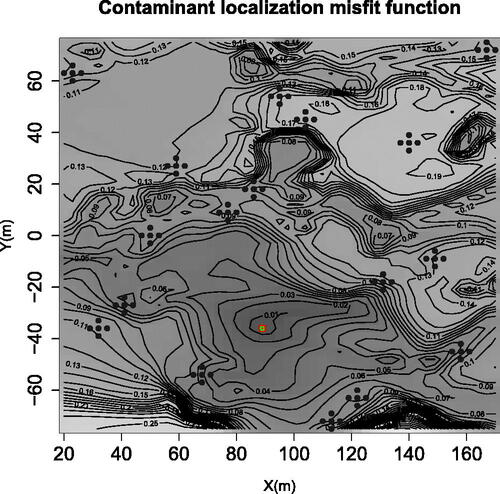
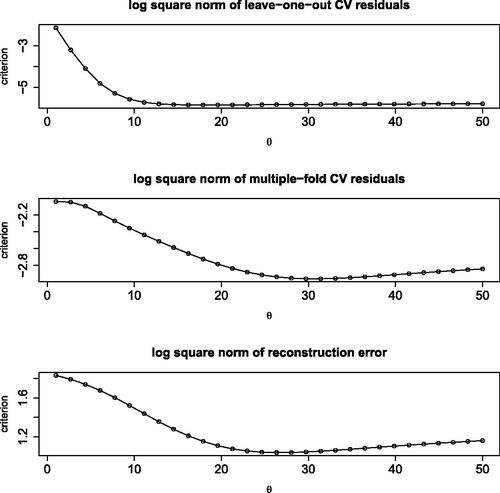
Fig. 7 Log square norm of LOO residuals (top), of MFCV residuals (center), and of reconstruction error (bottom) as a function of the range hyperparameter.