Figures & data
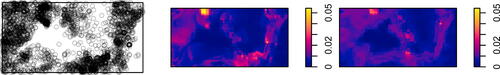
Fig. 1 The Barro Colorado Island dataset. From left to right, top to bottom: locations of trees, terrain elevation, terrain gradient, the soil contents of nitrogen, phosphorus, and potassium.
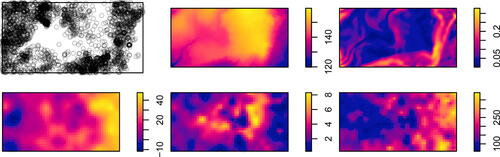
Fig. 2 Left to right: realization of a Poisson process with a quadratic intensity function, the nonparametric smoothed residual field, the parametric smoothed residual field with a log-linear model of the intensity function, the parametric smoothed residual field with a log-quadratic model of the intensity function.
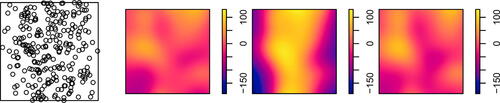
Fig. 3 Left: plot of the correlation coefficient as a function of the parameter a for the example in Section 3.2. Right: plot of the correlation coefficient
(black curve) and the partial correlation coefficient
(red curve) as functions of the parameter a for the example in Section 3.3.
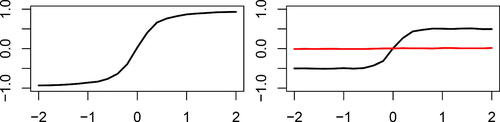
Table 1 Estimated sizes of the tests for experiments with independent covariates.
Table 2 Estimated powers of the tests for experiments with correlated covariates.
Table 3 Backward selection of covariates for the BCI dataset.
Fig. 4 The Barro Colorado Island dataset. Left to right: locations of trees, nonparametric estimate of the intensity function in the full model, nonparametric estimate in the final model with two covariates.