Figures & data
Table 1 Frequency and average number of the detected change points over 250 replications by each of the methods when there is one true change point, also including the case with no change point.
Table 2 Frequency and average number of the correctly detected change points over 250 replications by each of the methods when there are three true change points, also including the case with no change points.
Table 3 Frequency and average number of the detected change points over 250 replications by each of the methods when there is a true change in variance of observations.
Table 4 Frequency and average number of the detected change points over 250 replications by each of the methods when there is a change in distribution of observations while their mean and variance remain the same.
Figure 1 Illustrative example with one change point: plots for all elements of the distance matrix D obtained using the dissimilarity measure in (3) with both the univariate and multivariate distance functions, as well as for all column sums of the difference distance matrix Δ.
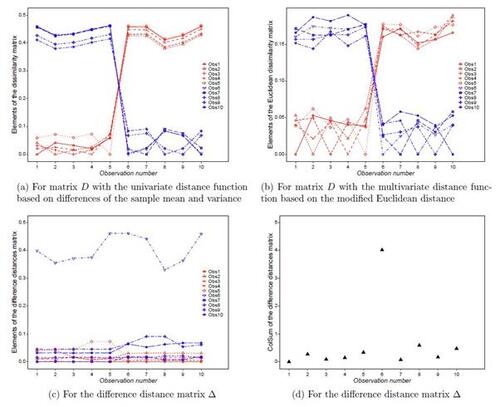
Figure 2 The sets and
with the estimated change point location
.
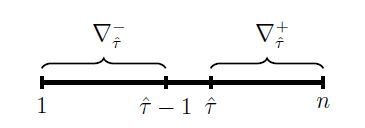
Figure 3 Illustrative example with two change points: plots for all elements of the distance matrix D obtained using the dissimilarity measure in (3) with both the univariate and multivariate distance functions, as well as for all column sums of the difference distance matrix Δ.
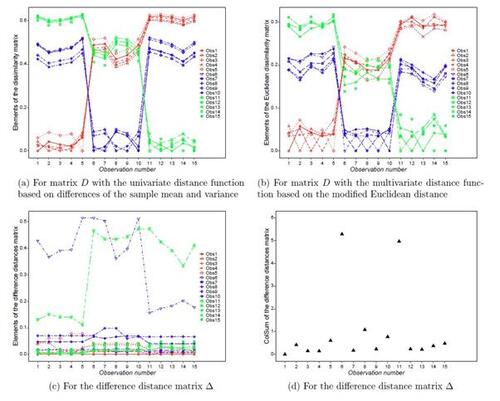
Figure 4 The estimate of change point from each of the methods over 250 replications with a true single change point at location when n = 45.
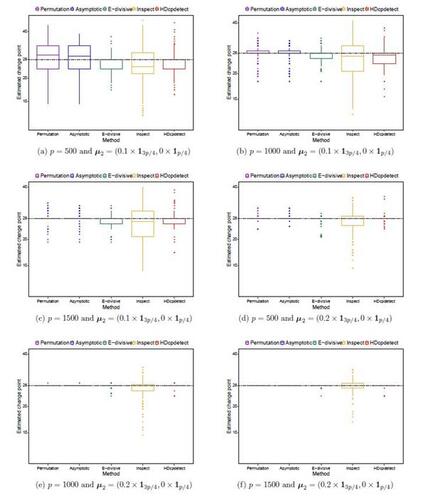
Figure 5 Average number of the total change points detected (correct or incorrect detection) over 250 replications by each of the methods for multiple change point detection.
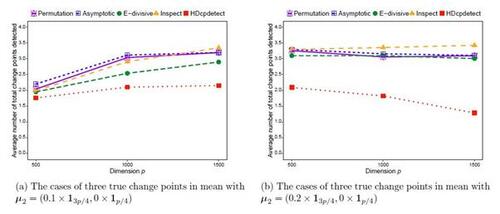
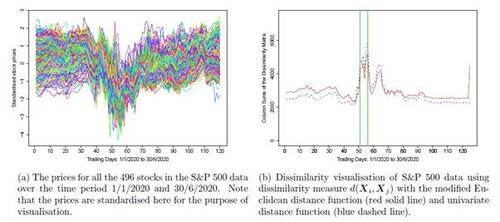
Figure 6 Change point plots for the S&P 500 data over the time period 1/1/2020 and 30/6/2020 during the COVID-19 pandemic. In plot (b) the two trading days 13th and 16th March 2020 show the largest total dissimilarity from all the other days and are marked by vertical bars (in green).