Figures & data
Figure 1. Ligand-based virtual screening using 3D shape and electrostatic fields. The IL-7Rα binding motif, a helix consisting of aa 72–91 from the IL-7 crystal structure (PDB code 3DI3), was utilized as a template for 3D similarity screening. Representation of electrostatic potential maps for the helix consisting of aa 72–91. The positive contours are coloured blue, and the negative contours are coloured red. A small-molecule compound obtained from EON is coloured yellow
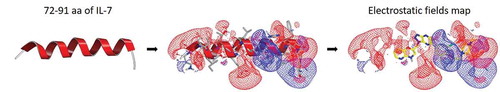
Figure 2. (a) Compound 1 structure, (b) the biochemical activity of compound 1 and (c) the biochemical activity of IL-7
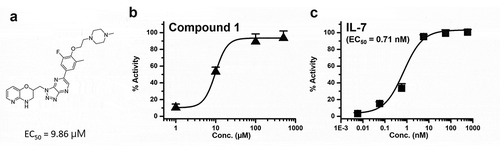
Table 1. Structure-activity relationships of IL-7 agonist activities
Figure 3. Three-dimensional shape and electrostatic contour map comparison between the α-helix consisting of aa 72–91 of IL-7 crystal structure and compound 1. (a) overlay of the aa 72–91 helix (red stick model) and compound 1 (yellow ball and stick model) and (b) structures of the aa 72–91 helix and compound 1 with electrostatic contour maps
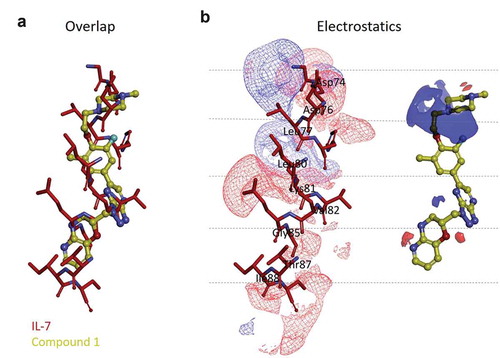
Figure 4. Molecular dynamics simulations of IL-7Rα/compound 1/γc complex models. (a) the protein-protein docking model of IL-7Rα bound compound 1, the pose of which is the superimposition of the 3D conformation by ligand-based virtual screening and γc, and (b) the equilibrium state complex model after 500 ns MD simulations. IL-7Rα subunit: blue ribbon model; compound 1: yellow ball and stick model; γc subunit: green ribbon model
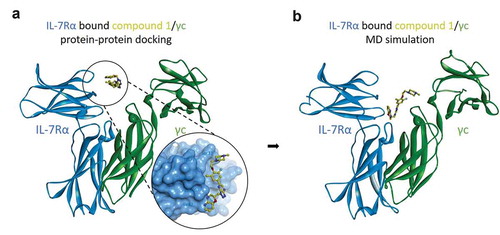
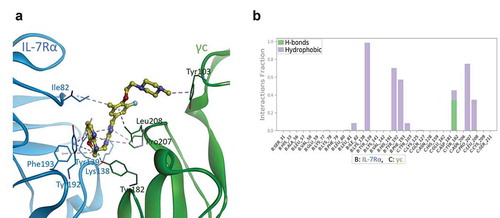
Figure 5. Proposed binding model and interaction profile analysis of compound 1 for IL-7Rα/γc proteins. (a) predicted binding mode of compound 1 (yellow ball and stick model) after 500 ns MD simulations. The IL-7Rα and γc proteins are displayed as blue and green ribbon models, respectively. The hydrogen bonds are shown as green dashed lines, and hydrophobic interactions are represented by pink dashed lines. (b) contact histograms of IL-7Rα (B chain)/γc (C chain) proteins with compound 1 are represented as a coloured stacked bar plot between 200 and 500 ns MD simulations. Hydrogen bonding is displayed by yellow-green coloured bars, and hydrophobic interactions are displayed by lavender coloured bars for clarity