Figures & data
Table 1. Docking scores and interactions of high priority molecules with SARS-CoV-2 nucleotide-binding site
Figure 1. Superimposition of the atomic structure of SARS-CoV-2 helicase (yellow; PDB_ID:5RL9) and atomic structure of MERS-CoV helicase (magenta; PDB_ID:5WWP). Nucleotide binding site of both structures was identified by residue R443 (blue) of MERS-CoV helicase
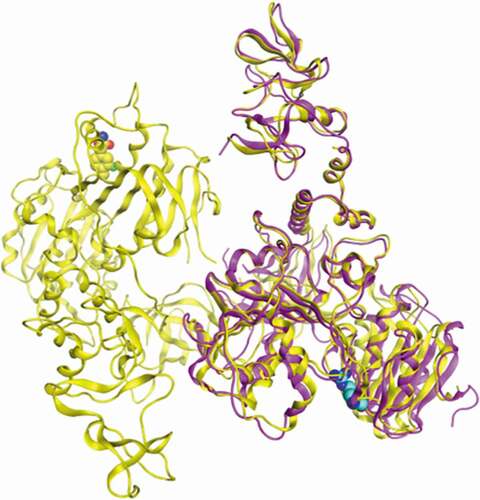
Figure 2. Zafirlukast docking to SARS-CoV-2 helicase: (a) A dock pose of zafirlukast (ball-and–stick model) to SARS-CoV-2 helicase nucleotide binding site (surface view) using MOE. Protein was allowed 9 Å flexibility away from ligand. Zafirlukast is presented (b) Interaction map of zafirlukast with SARS-CoV-2 helicase. The basic, acidic and the polar amino acids are represented by the pink spheres with blue, red and black outlines respectively. Hydrophobic residues are presented in green. Blue and green arrows indicate hydrogen bonding to backbone and side chain atoms respectively. The fuzzy blue spheres represent the ligand atoms exposed to solvent as determined by the docking process. Light-blue shadows around residues indicate the degree of interaction with ligand atoms. The dotted contour reflects steric. The steric room for methyl substitution is presented by dotted contours
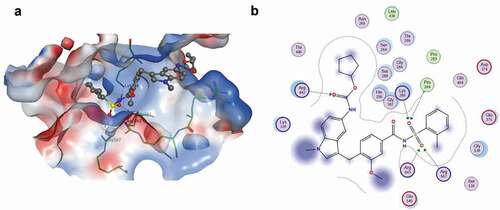
Table 2. Kinetic parameters of SARS-CoV-2 helicase
Figure 3. SARS-CoV-2 helicase expression and activity: (a) Helicase purification analysed by SDS-PAGE and detected by Coomassie staining. Lane 1, prestained molecular standards (BioRad); lane 2, eluted SARS-CoV-2 helicase from Strep-Tactin column. (b) SARS-CoV-2 helicase ATPase activity incubated measured by monitoring the change in absorbance of the released inorganic phosphate at 650 nm after the addition of detection dye after incubation of 250 nM dsDNA and 0.25 mM ATP for 60 min at no enzyme or with 20 nM SARS-CoV-2 helicase. (c) SARS-CoV-2 helicase activity measured by monitoring the change in fluorescence (excitation 495 nm, emission 520 nm) for 10 min incubation of 75 nM fluorescein- and black hole quencher-labelled dsDNA and 0.5 mM ATP at no enzyme or 50 nM SARS-CoV-2 helicase
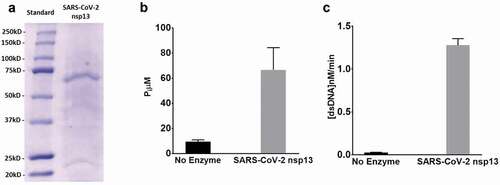
Table 3. IC50 values of SARS-CoV-2 inhibitors
Figure 4. SARS-CoV-2 helicase inhibition by compounds identified by virtual screening: (a) SARS-CoV-2 helicase activity measured in the presence of 75 nM fluorescein- and black hole quencher-labelled dsDNA, 0.5 mM ATP and 100 mM of zafirlukast, bosentan hydrate, rigosertib, chondroitin sulphate, encorafenib, darunavir, mezlocillin sodium, tianeptine sodium, lapatinib, or DMSO. (b) IC50 value of zafirlukast was measured using the FRET-based assay. The SARS-CoV-2 helicase was incubated with 75 nM fluorescein- and black hole quencher-labelled dsDNA, 0.5 mM ATP and various concentrations: 0 µM, 1 × 10⁻³ µM, 1.7 × 10⁻³ µM, 5.1 × 10⁻³ µM, 15.2 × 10⁻³ µM, 45.7 × 10⁻³ µM, 0.1372 µM, 0.4115 µM, 1.234 µM, 3.704 µM, 11.11 µM, 33.33 µM, and 100 µM of zafirlukast. (c) The SARS-CoV-2 helicase activity measured in the presence of 75 nM fluorescein- and black hole quencher-labelled dsDNA, 0.5 mM ATP and 25 µM of zafirlukast or montelukast
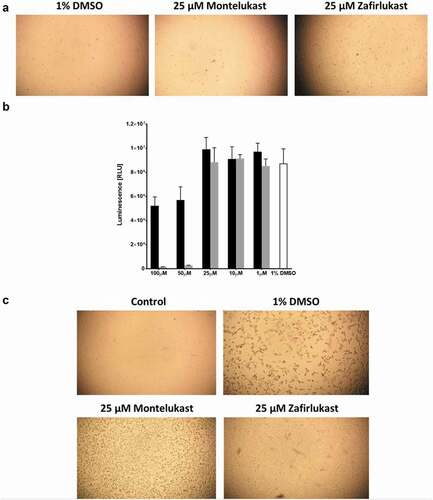
Figure 5. The effect of zafirlukast and montelukast on Vero E6 cells infection by SARS-CoV-2:(a) Integrity of Vero E6 cells inoculated in the presence of 1% DMSO, 25 µM zafirlukast or 25µ montelukast. (b) Vero E6 cells viability measured by TitreGlo assay after overnight incubation at 37°C and 5% CO2 in the presence of 1%DMSO (white), zafirlukast (black), or montelukast (grey). (c) The integrity of Vero E6 cells treated with 1% DMSO and not infected (control) or treated with 1% DMSO, 25 µM montelukast, or 25 µM zafirlukast and then infected with SARS-CoV-2