
Figures & data
Table 1. Grid box features for molecular docking.
Table 2. Selected 19 compounds for MD simulations and reference molecule.
Table 3. Selected 19 compounds for MD simulations and reference molecule.
Table 4. Binding affinities of docked compounds.
Figure 1. Reference compound (a) and compound 5 (b) in the binding pocket. Ligand interactions were determined by DSV. The dashed lines show the interactions between the relevant residue and the compound according to their colour.
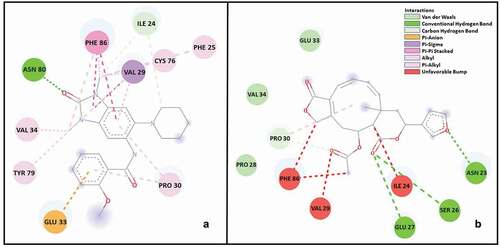
Table 5. Average RMSD values during the 150 ns MD simulation of all compounds and reference.
Figure 2. RMSF values were observed during 150 ns MD simulation on residues in the BRPF1 protein. The black line plots compound 5 and the red line plots the reference compound.
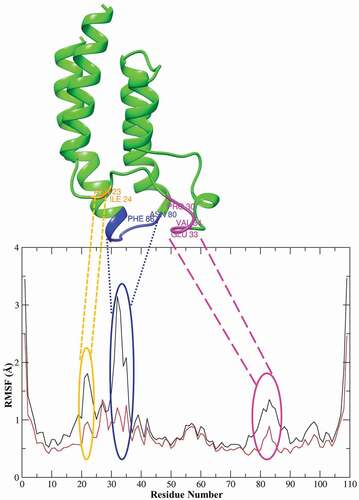
Figure 3. Position and hydrogen bonds of 5 in the binding pocket after 150 ns of MD. The black dashed lines represent hydrogen bonds.
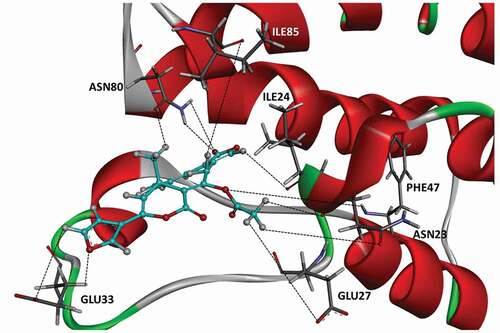
Figure 4. Position and hydrogen bonds of compound 30 in the binding pocket after 150 ns of MD. The black dashed lines represent hydrogen bonds.
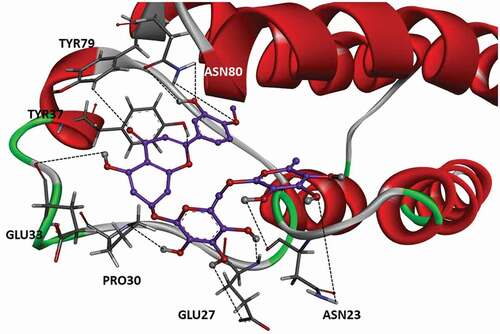
Table 6. H bond analysis results for compound 5.
Figure 5. Energetic values for selected 19 compounds and reference molecule.
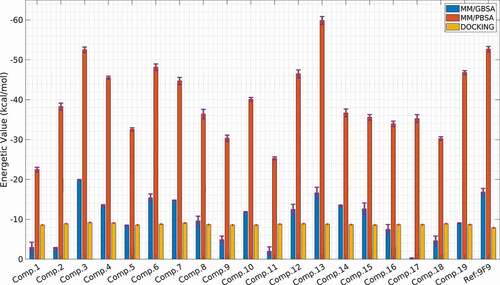
Table 7. Binding free energies for compounds 5, 30 and reference.