Figures & data
Table 1. Overview of the First and Second Ames/QSAR International Challenge Projects.
Table 2. Teams participating in the Second Project.
Table 3. Number of chemicals in the Ames classes in the trial set for the Second Project.
Table 4. Performance metrics used to evaluate Ames/QSAR model performance.
Table 5. Sample of training data provided to the participants of the Second Project*.
Table 6. Curation of the training dataset used in the Second Project.
Table 7. Models selected by each team BEFORE access to Ames test results for the trial chemicals.
Table 8. Models selected by each team AFTER access to Ames test results for the trial chemicals.
Table 9. Performance metrics for the models selected BEFORE access to the Ames test results*1.
Table 10. Performance metrics for the models selected AFTER access to the Ames test results*1.
Table 11. Averages (and ranges) of performance metrics for all models in the Second Project versus the First Project*1.
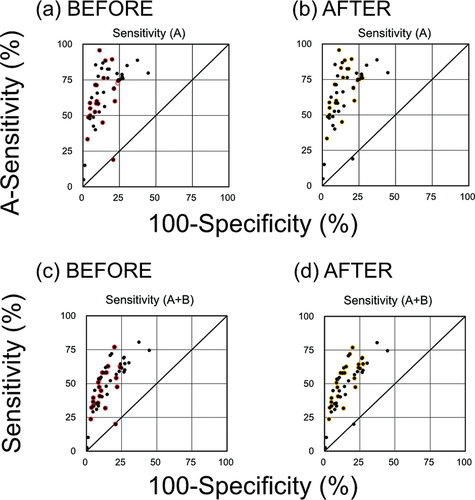
Figure 1. Receiver operating characteristic graphs of Ames mutagenicity prediction for the QSAR models. (a, b) Sensitivity to class A chemicals (A-sensitivity) versus specificity to class C chemicals. (c, d) Sensitivity to class A + B chemicals versus specificity to class C chemicals. Each black dot represents a single QSAR model from one of the participating teams. Red and yellow circles indicate the models selected before and after access to the Ames test data, respectively.