Figures & data
Figure 1. Chemical structure of betulinic acid.
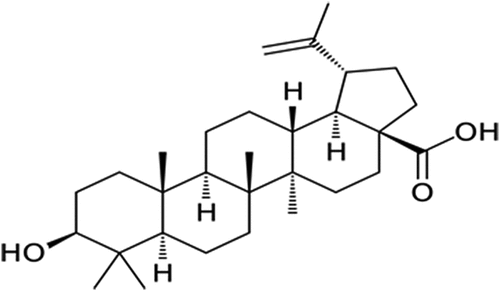
Figure 2. (a) α-amylase and (b) α-glucosidase inhibitory activities of betulinic acid. Data = mean ± SD; n = 3. abValues with different letters above the bars for a given concentration are significantly (p < 0.05) different from each other.
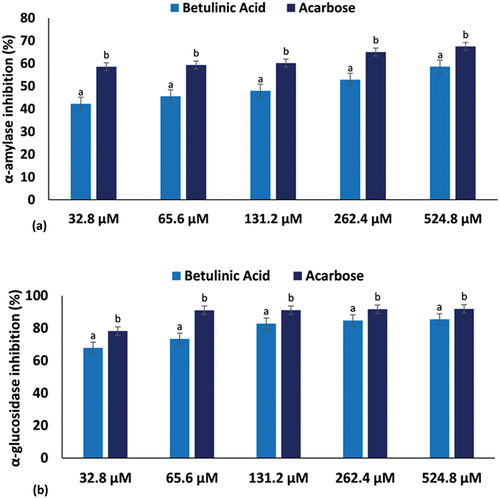
Table 1. IC50 values of biological activities.
Figure 3. (a) Pancreatic lipase and (b) α-chymotrypsin inhibitory activities of betulinic acid. Data = mean ± SD; n = 3. abValues with different letters above the bars for a given concentration are significantly (p < 0.05) different from each other.
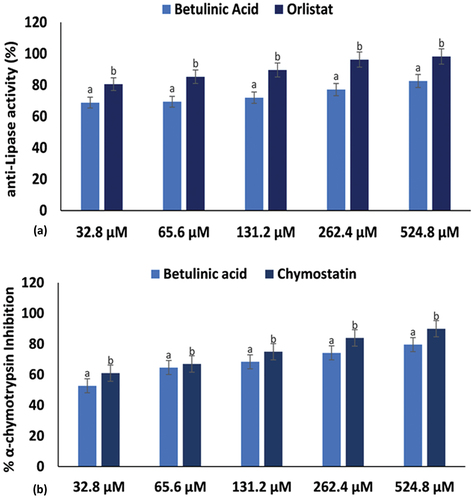
Figure 4. Optimized structure of betulinic acid.
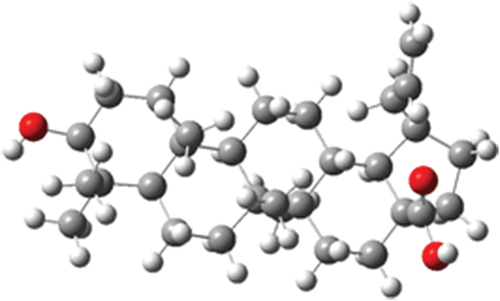
Table 2. Electronic and reactivity descriptors.
Figure 5. Frontier molecular orbitals of betulinic acid in (a) gas phase and (b) water.
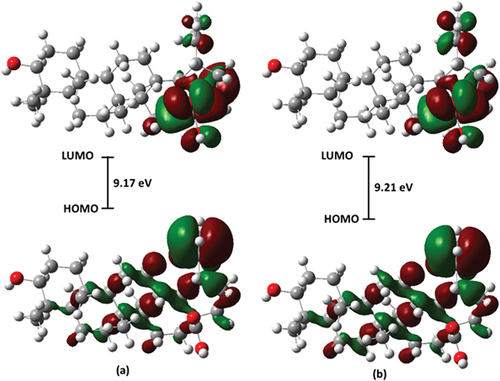
Figure 6. Molecular electrostatic potential surface of betulinic acid in (a) gas phase and (b) water.
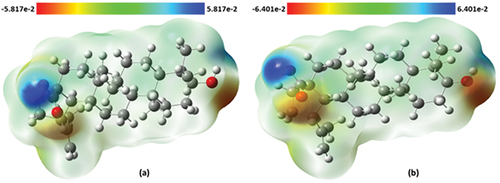
Table 3. RMSD, RMSF and SASA profile of betulinic acid bound to lipase, α-amylase, α-chymotrypsin and α-glucosidase.
Figure 7. Structural representation of alterations occurring during the binding of betulinic acid with lipase (black), amylase (red), chymotrypsin (green) and glucosidase (purple), showing the conformational stability, C-α atoms RMSD for targeted enzymes to betulinic acid bound.
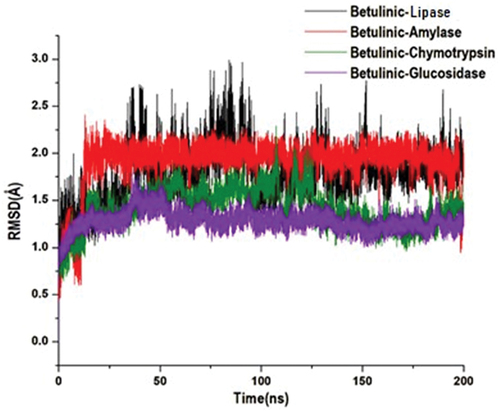
Figure 8. The time evolution RMSF of each residue of the enzymes C-α atom over 200 ns for betulinic acid bound to lipase, α-amylase, α-chymotrypsin and α-glucosidase.
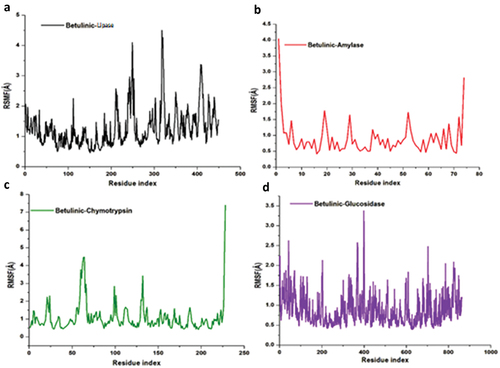
Figure 9. Structural representation of alterations occurring during the binding of betulinic acid, solvent accessible surface area of the four targeted enzymes.
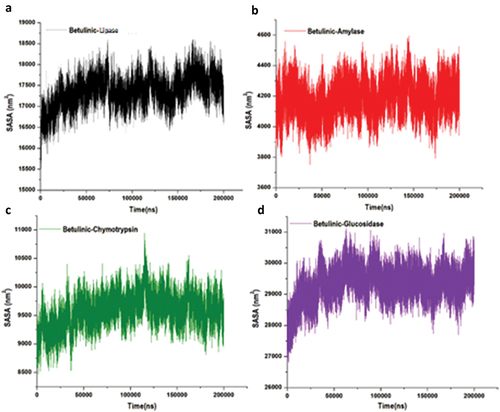
Table 4. MM/GBSA-based binding free energy profile of betulinic acid bound to lipase, α-amylase, α-chymotrypsin and α-glucosidase.
Figure 10. Per-residue decomposition plots showing individual energy contributions to the binding and stabilization of betulinic acid inhibitor at the binding sites of lipase (a), α-amylase (b), α-chymotrypsin (c) and α-glucosidase (d) enzymes. This reveals that energy contributions were highest in binding sites amino acid.
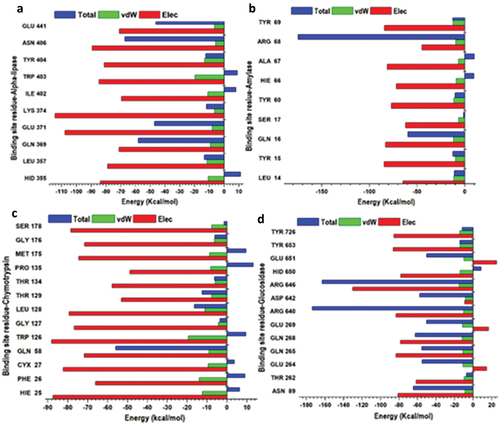
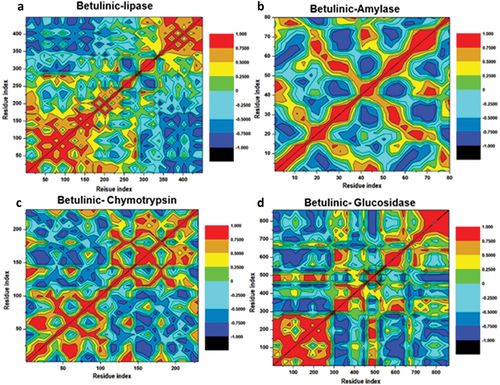
Figure 11. Dynamic cross-correlation matrix analyses for Betulinic acid where (a), (b), (c) and (d) represent inhibitor binding mode at the binding site of lipase, α-amylase, α-chymotrypsin and α-glucosidase enzymes. Numbers closer to 1 indicate high correlation, while those closer to − 1 indicate anticorrelation between pairs of residues.