Figures & data
Figure 1. Post-earthquake changes in the spatial structure of L’Aquila: new settlements and the abandoned historical core. Sources: 2011 Census; Protezione Civile, Citation2016
Table 1. Modal split of trips to work and study in L’Aquila, before and after the earthquake. Sources: Comune dell’Aquila, 2012; Istat, 2016
Figure 2. Example of information linked to the bus stops in the database and provided to passengers on selected stops. Source: AMA
Figure 3. The geo-referenced bus stops and bus lines of L’Aquila. Source: authors' elaboration
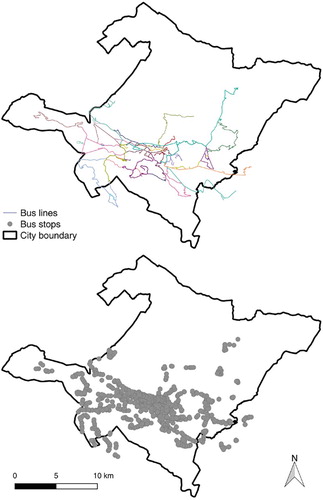
Figure 4. Example of timetable for a line with a number of sub-lines. Source: AMA
Figure 5. Spatial accessibility of the bus network in L’Aquila. Source: own elaboration
Table 2. Number of bus lines accessible from census tracts and new settlements. Source: authors’ elaboration
Figure 6. Architecture of the proposed software
Figure 7. Routes menu
Figure 8. Trip planner form, route visualization on map, and textual representation of itinerary
Figure 9. A screenshot of our GTFS editor