Figures & data
Figure 1. Schematic illustration of the Dutch Mobile Mobility Panel data collection methodology.
Source: Geurs et al., 2015
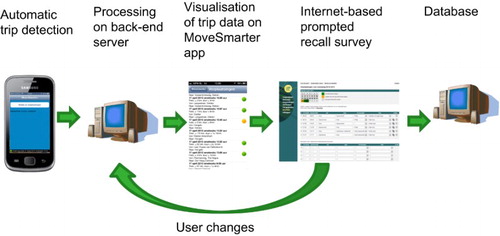
Table 1. Relevant data sources with descriptions
Figure 2. Average number of trip legs per person per day, 2015
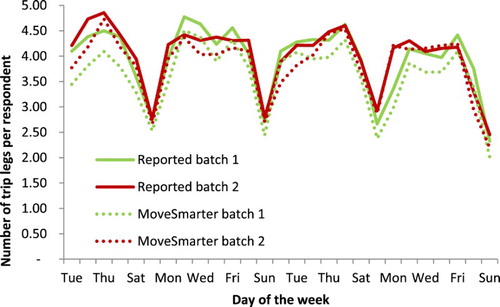
Figure 3. Number of respondents per day in the final 2015 sample
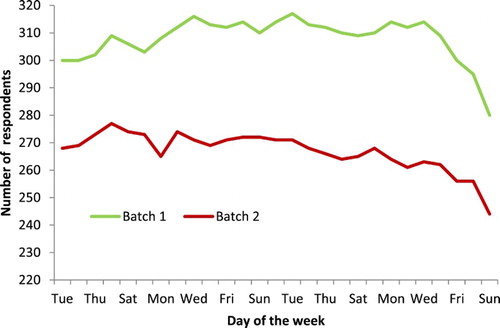
Table 2. Percentage of successful mode detections for the 2015 wave, distinguishing between trips with different trip lengths (second column) and travel times (third column)
Table 3. Trip generation to activities (without transfers). Comparison between self-reporting with and without MoveSmarter for a sample of 519 persons
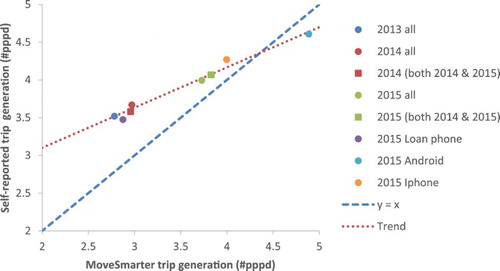
Figure 4. Self-reported trip rates versus trip rates registered by MoveSmarter