Figures & data
Figure 1. Research design: online search process and textual analyses
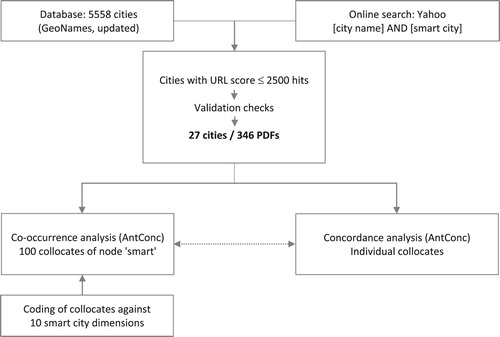
Table 1. 27 cities co-constituting the smart city global discourse network
Figure 2. Distribution of 10 smart city dimensions (100 collocates) for overall corpus*
Note: *Percentage calculation based on T-score (sum of T-score of individual collocates).**Self-referenced city/country names (e.g. use of ‘London’ and ‘UK’ in London-related texts) are excluded from the dimension ‘International’.
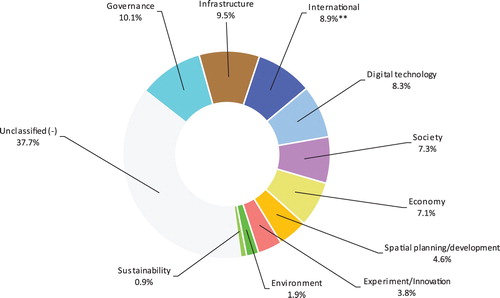
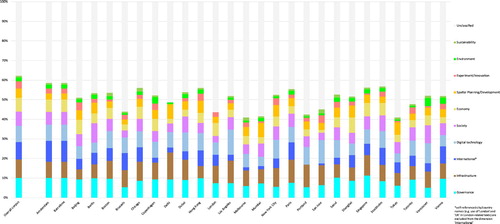
Figure 3. Smart city dimensions across 27 corpora