
Figures & data
Figure 1. Definition of first and last mile relating to different stages of trips
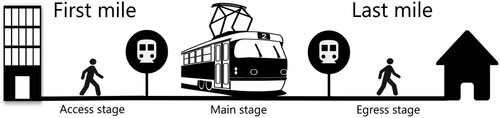
Table 1. Reported values for willingness to walk to public transport (in meters and for the average individual)
Figure 2. Stockholm County in Sweden
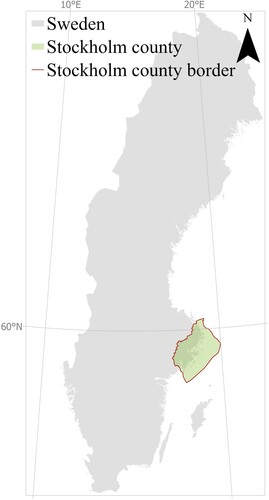
Figure 3. The spatial structure map of development areas established in RUFS 2050 (Region Stockholm Citation2018d)
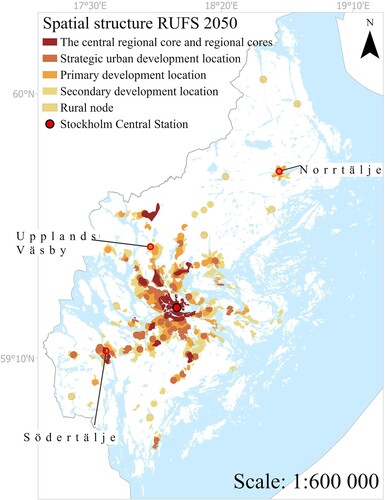
Table 2. First mile/last mile (FM/LM) threshold distances (meters) for the average population and the elderly and elderly impaired subgroups
Table 3. Data used for modeling in Geographic Information System (GIS)
Figure 4. Service areas with access to public transport (left) and buildings lacking access to public transport (right) in the 2019 scenario shown on top of each other in each population group
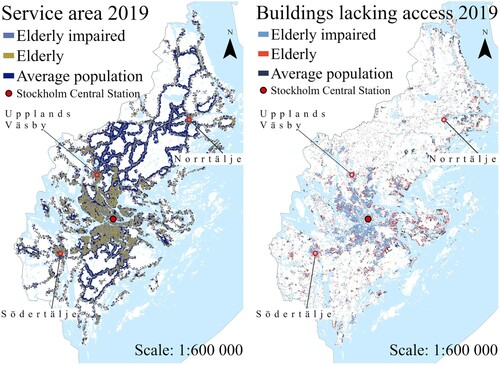
Figure 5. Services areas with access to public transport (left) and buildings lacking access to public transport (right) in the 2019 scenario, showing central areas of Stockholm City
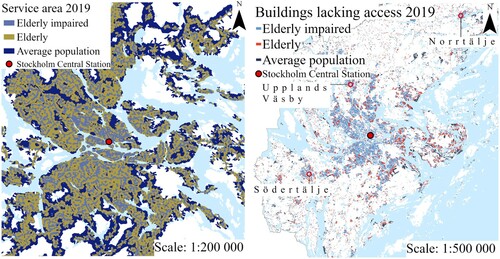
Figure 6. Areas lacking access in 2019 that will have gained access to public transport by 2035
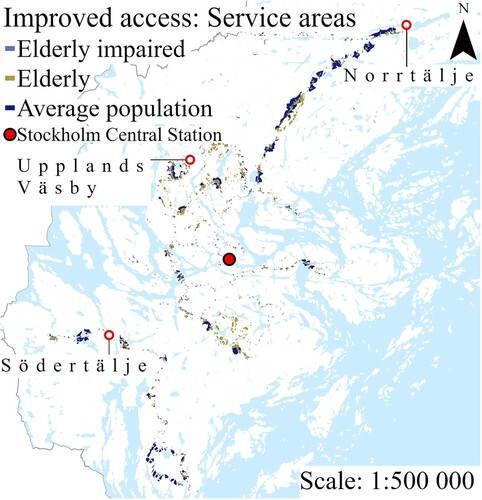
Figure 7. Buildings lacking access in 2019 that will have gained access to public transport by 2035. The figure shows central areas in Stockholm City
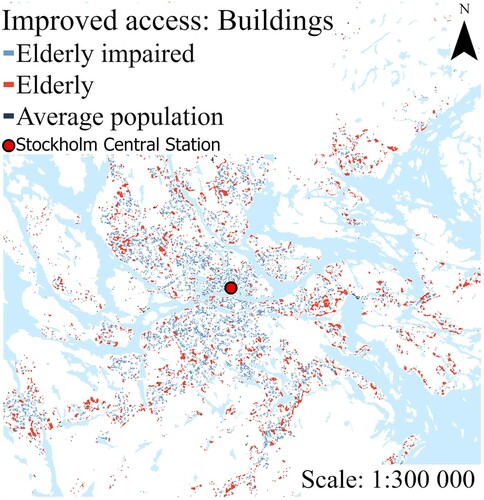
Figure 8. Network service area for the average population (left) and for population subgroups (right) as an overlay on the planned development areas. Areas in red rectangles are areas lacking access to public transport. For the elderly and elderly impaired, areas highlighted reflect problem areas that remain in the Euclidean service area
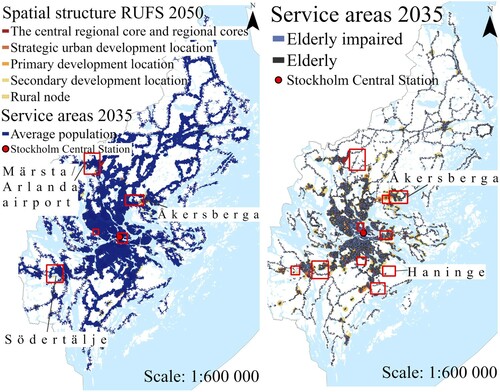
Figure 9. Close-up of potential problem areas south of Stockholm city center, shown in red rectangles for the population subgroups in the 2035 scenario
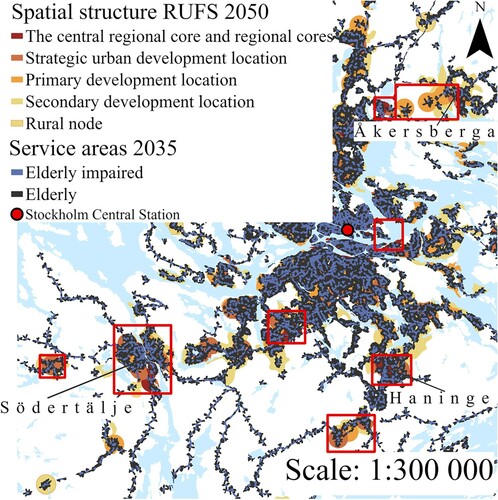
Table 4. Changes with future development in public transport access up until 2035 for the average population and the elderly and elderly impaired subgroups