
Figures & data
Table 1. Means, standard deviations and paired t-tests for adolescents’ outcome data
Figure 1. Adolescents’ BMI and parental caregiver burden (EDSIS) pre- and post-treatment. *p <,05, **p <,01, ***p <,001, adolescents (n = 24), mothers (n = 23) and fathers (n = 22)
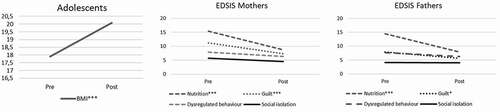
Table 2. Summary of intercorrelations for scores on parents’ burden for all parents pre treatment
Table 3. Means and standard deviations, and paired T-tests for mothers’ and fathers’ caregiving burden (eating disorders symptom impact scale)
Table 4. Summary of pearson correlations between pretest scores on the parents’ caregiving burden and difference scores on children’s symptoms and function
Table 5. Summary of pearson correlations between difference scores on the parents’ caregiving burden and difference scores on children’s symptoms and function